ECE 486 Control Systems
Lecture 14
Bode Plots
Recall from last time, given open loop transfer function \(KG(s)\) evaluated at \(s = j \omega\), we can have a Bode plot where we plot magnitude \(|KG(j\omega)|\) and phase \(\angle KG(j\omega)\) versus frequency \(\omega\); or we can have a Nyquist plot where we plot the complex trajectory \({\rm Im} \big(KG(j\omega)\big)\) versus \({\rm Re}\big(KG(j\omega)\big)\) in the $s$-plane as \(\omega\) ranges from \(-\infty\) to \(+\infty\).
In this lecture, we shall study the Bode plots for three types of transfer functions and from there we learn to analyze and sketch magnitude and phase plots of transfer functions written in Bode form — starting with simple factors and then building up to general transfer functions by considering products of these simple factors.
Bode Form of Transfer Function
Bode form of \(KG(s)\) is a factored form with the constant term in each factor equal to \(1\), i.e., lump all DC gains into one number in the front.
For example, consider \[ KG(s) = K\frac{s+\color{red}{3}}{s(s^2 + 2s + \color{blue}{4})}, \]
it can be rewritten as
\begin{align*} &\frac{\color{red}{3}K \left(\frac{s}{3}+1\right)}{\color{blue}{4}s \left( \big(\frac{s}{2}\big)^2 + \frac{s}{2} + 1 \right)}\Bigg|_{s=j\omega} \\ =\,& \underbrace{\frac{\color{red}{3}K}{\color{blue}{4}}}_{=K_0} \frac{\frac{j\omega}{3}+1}{j\omega \left(\big(\frac{j\omega}{2}\big)^2 + \frac{j\omega}{2} + 1\right)}. \end{align*}Three Types of Factors
Transfer functions in Bode form will have three types of factors,
- \(K_0(j\omega)^n\), where \(n\) is a positive or negative integer;
- \((j\omega \tau + 1)^{\pm 1}\);
- \(\left[\Big(\dfrac{j\omega}{\omega_n}\Big)^2 + 2\zeta \dfrac{j\omega}{\omega_n} + 1\right]^{\pm 1}\) ;
In our example above,
\begin{align*} KG(j\omega) &= \frac{3K}{4} \frac{\frac{j\omega}{3}+1}{j\omega \left[\Big(\frac{j\omega}{2}\Big)^2 + \frac{j\omega}{2} + 1\right]} \\ &= \underbrace{\frac{3K}{4}(j\omega)^{-1}}_{\text{Type 1}} \cdot \underbrace{\left(\frac{j\omega}{3}+1\right)}_{\text{Type 2}} \cdot \underbrace{\left[\Big(\frac{j\omega}{2}\Big)^2 + \frac{j\omega}{2} + 1\right]^{-1}}_{\text{Type 3}}. \end{align*}We shall now discuss Bode plots for factors of each type.
Type 1: \(K_0(j\omega)^n\)
Its magnitude is
\begin{align*} \log M &= \log |K_0 (j\omega)^n| \\ &= \log |K_0| + n \log \omega. \end{align*}It is a linear function of \(\log \omega\); hence a line of slope \(n\) passing through the value \(\log |K_0|\) at \(\omega = 1\). This line is called a low-frequency asymptote.
In our example above, we had \(K_0(j\omega)^{-1}\). Its magnitude plot is shown as in Figure 1.
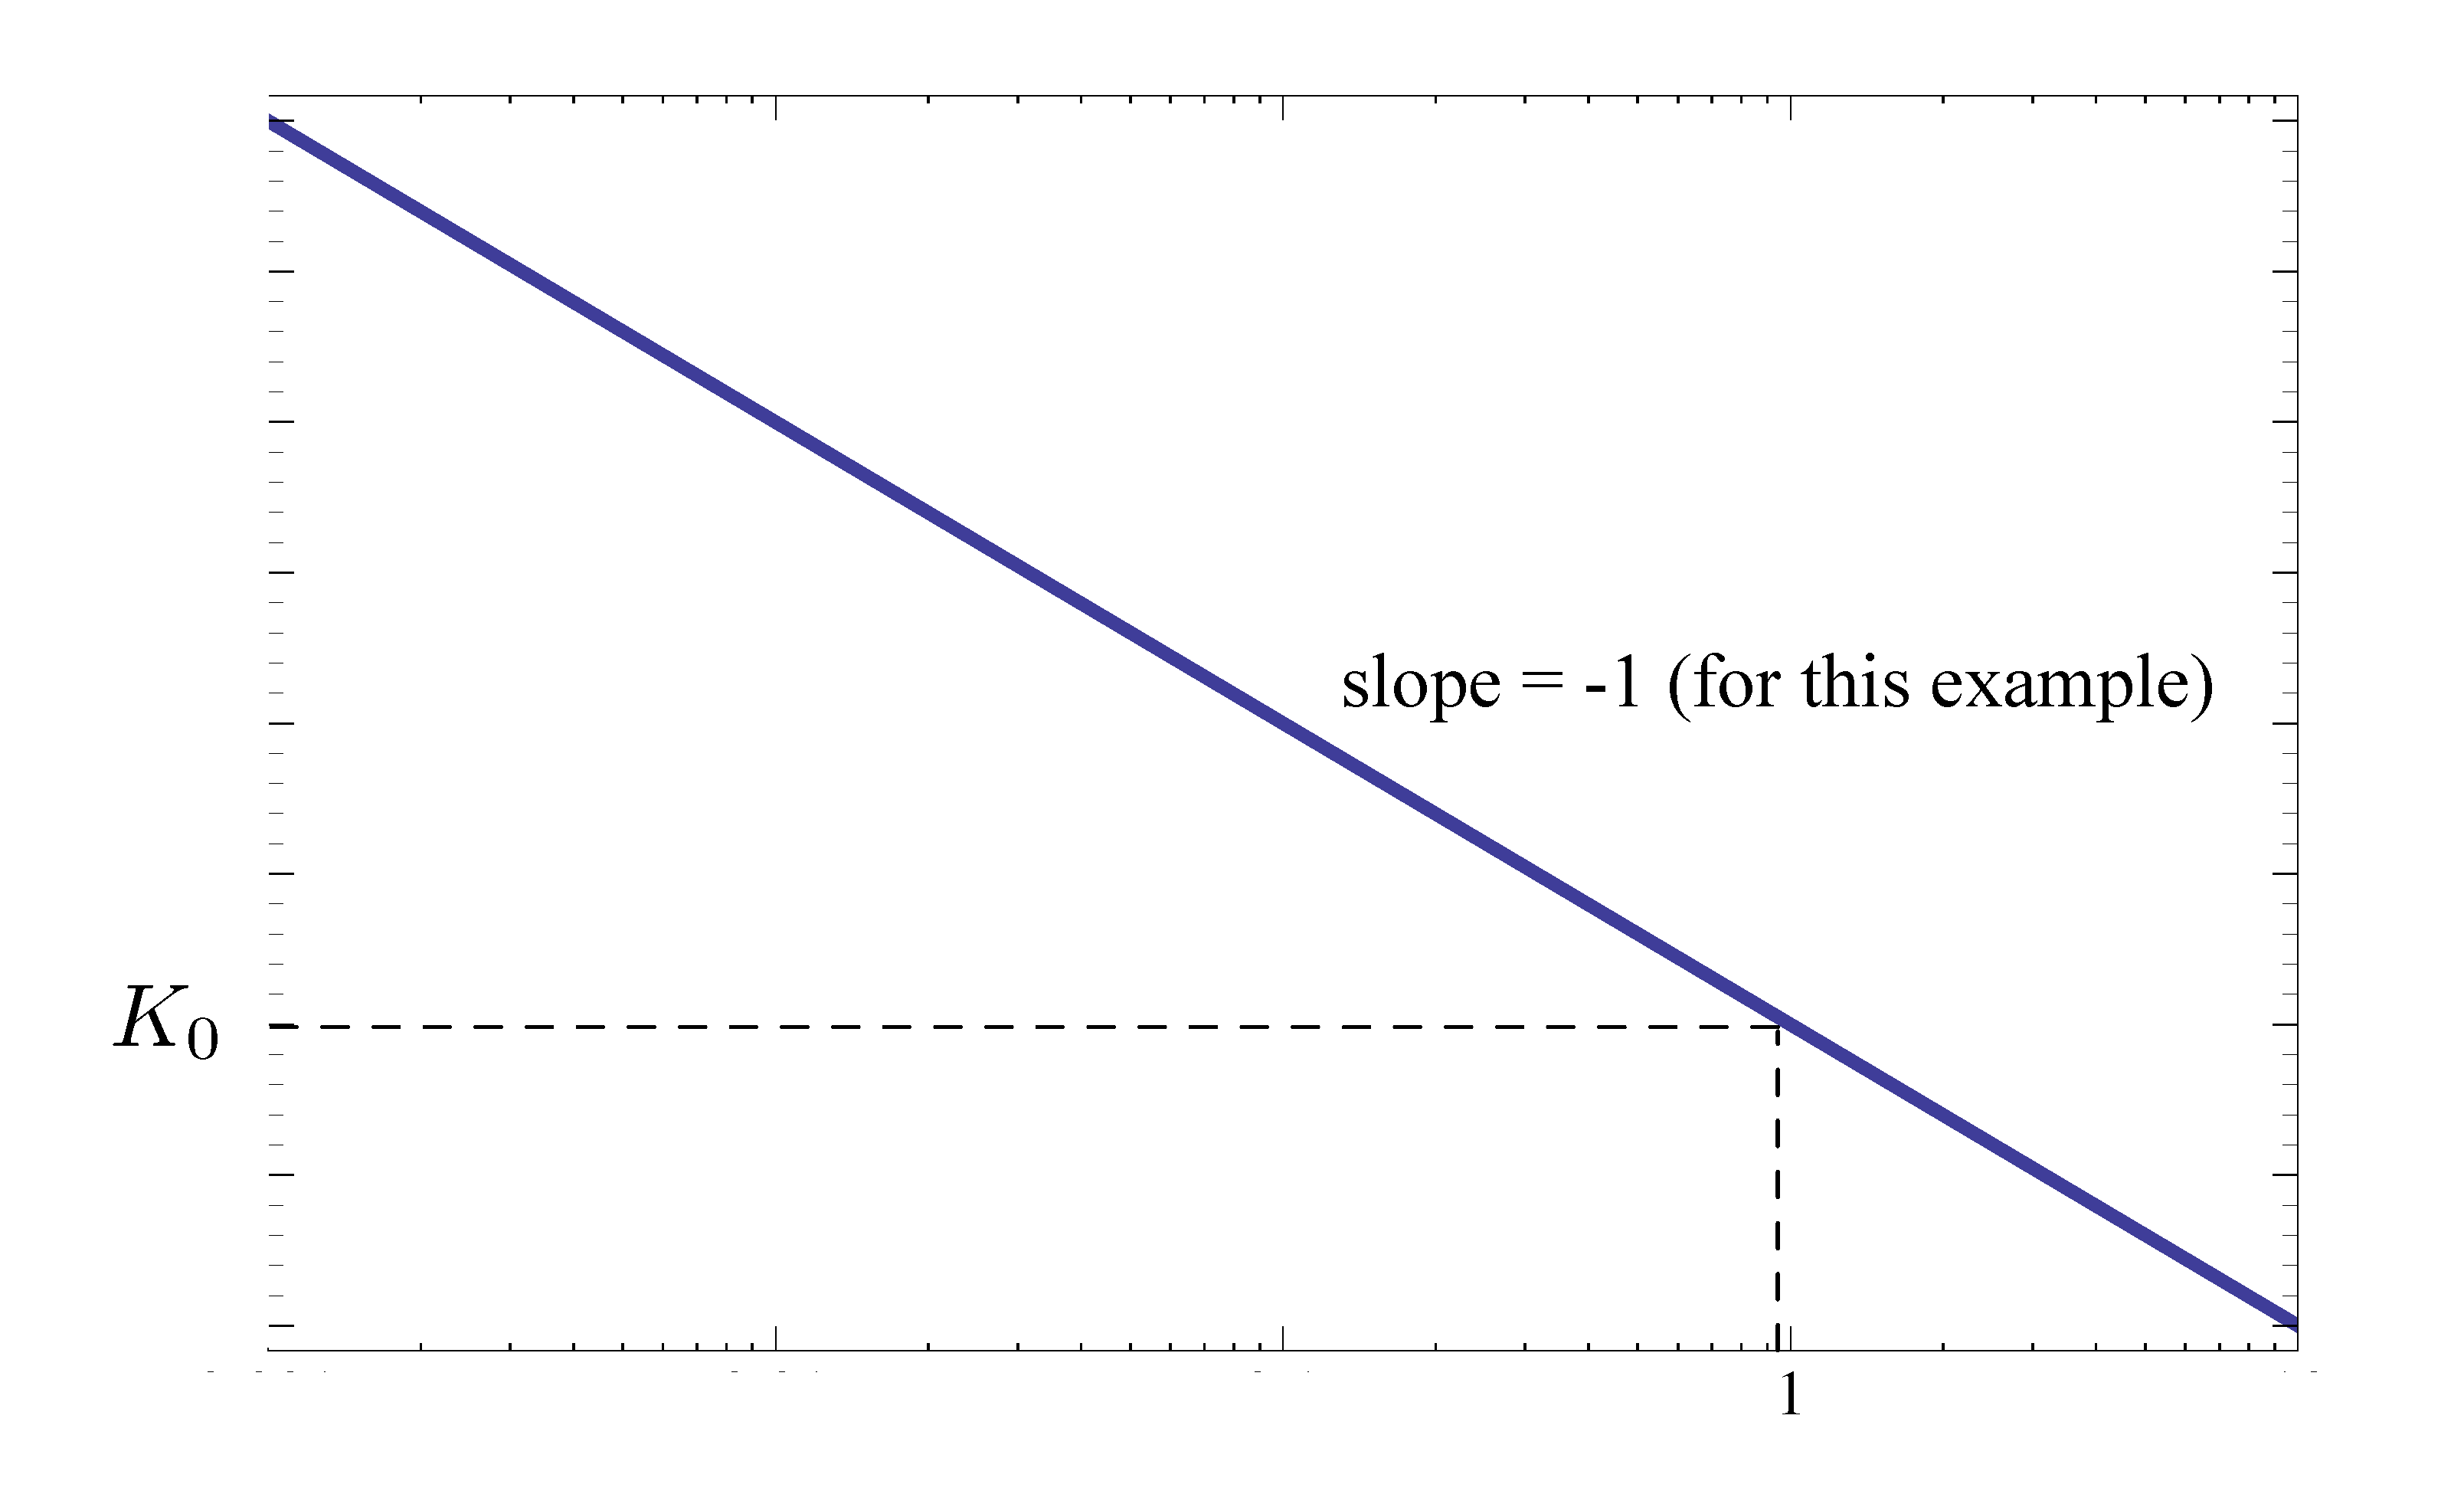
Figure 1: Magnitude plot of \(K_0(j\omega)^{-1}\)
For Type 1 factor, its phase is
\begin{align*} \angle K_0(j\omega)^n &= \angle (j\omega)^n \\ &= n \angle j\omega \\ &= n \cdot 90^\circ. \end{align*}The phase is therefore a constant independent of \(\omega\).
In our example above, we had \(K_0(j\omega)^{-1}\). Its phase plot is shown as in Figure 2. In this example, the phase is \(-90^\circ\) for all \(\omega\).
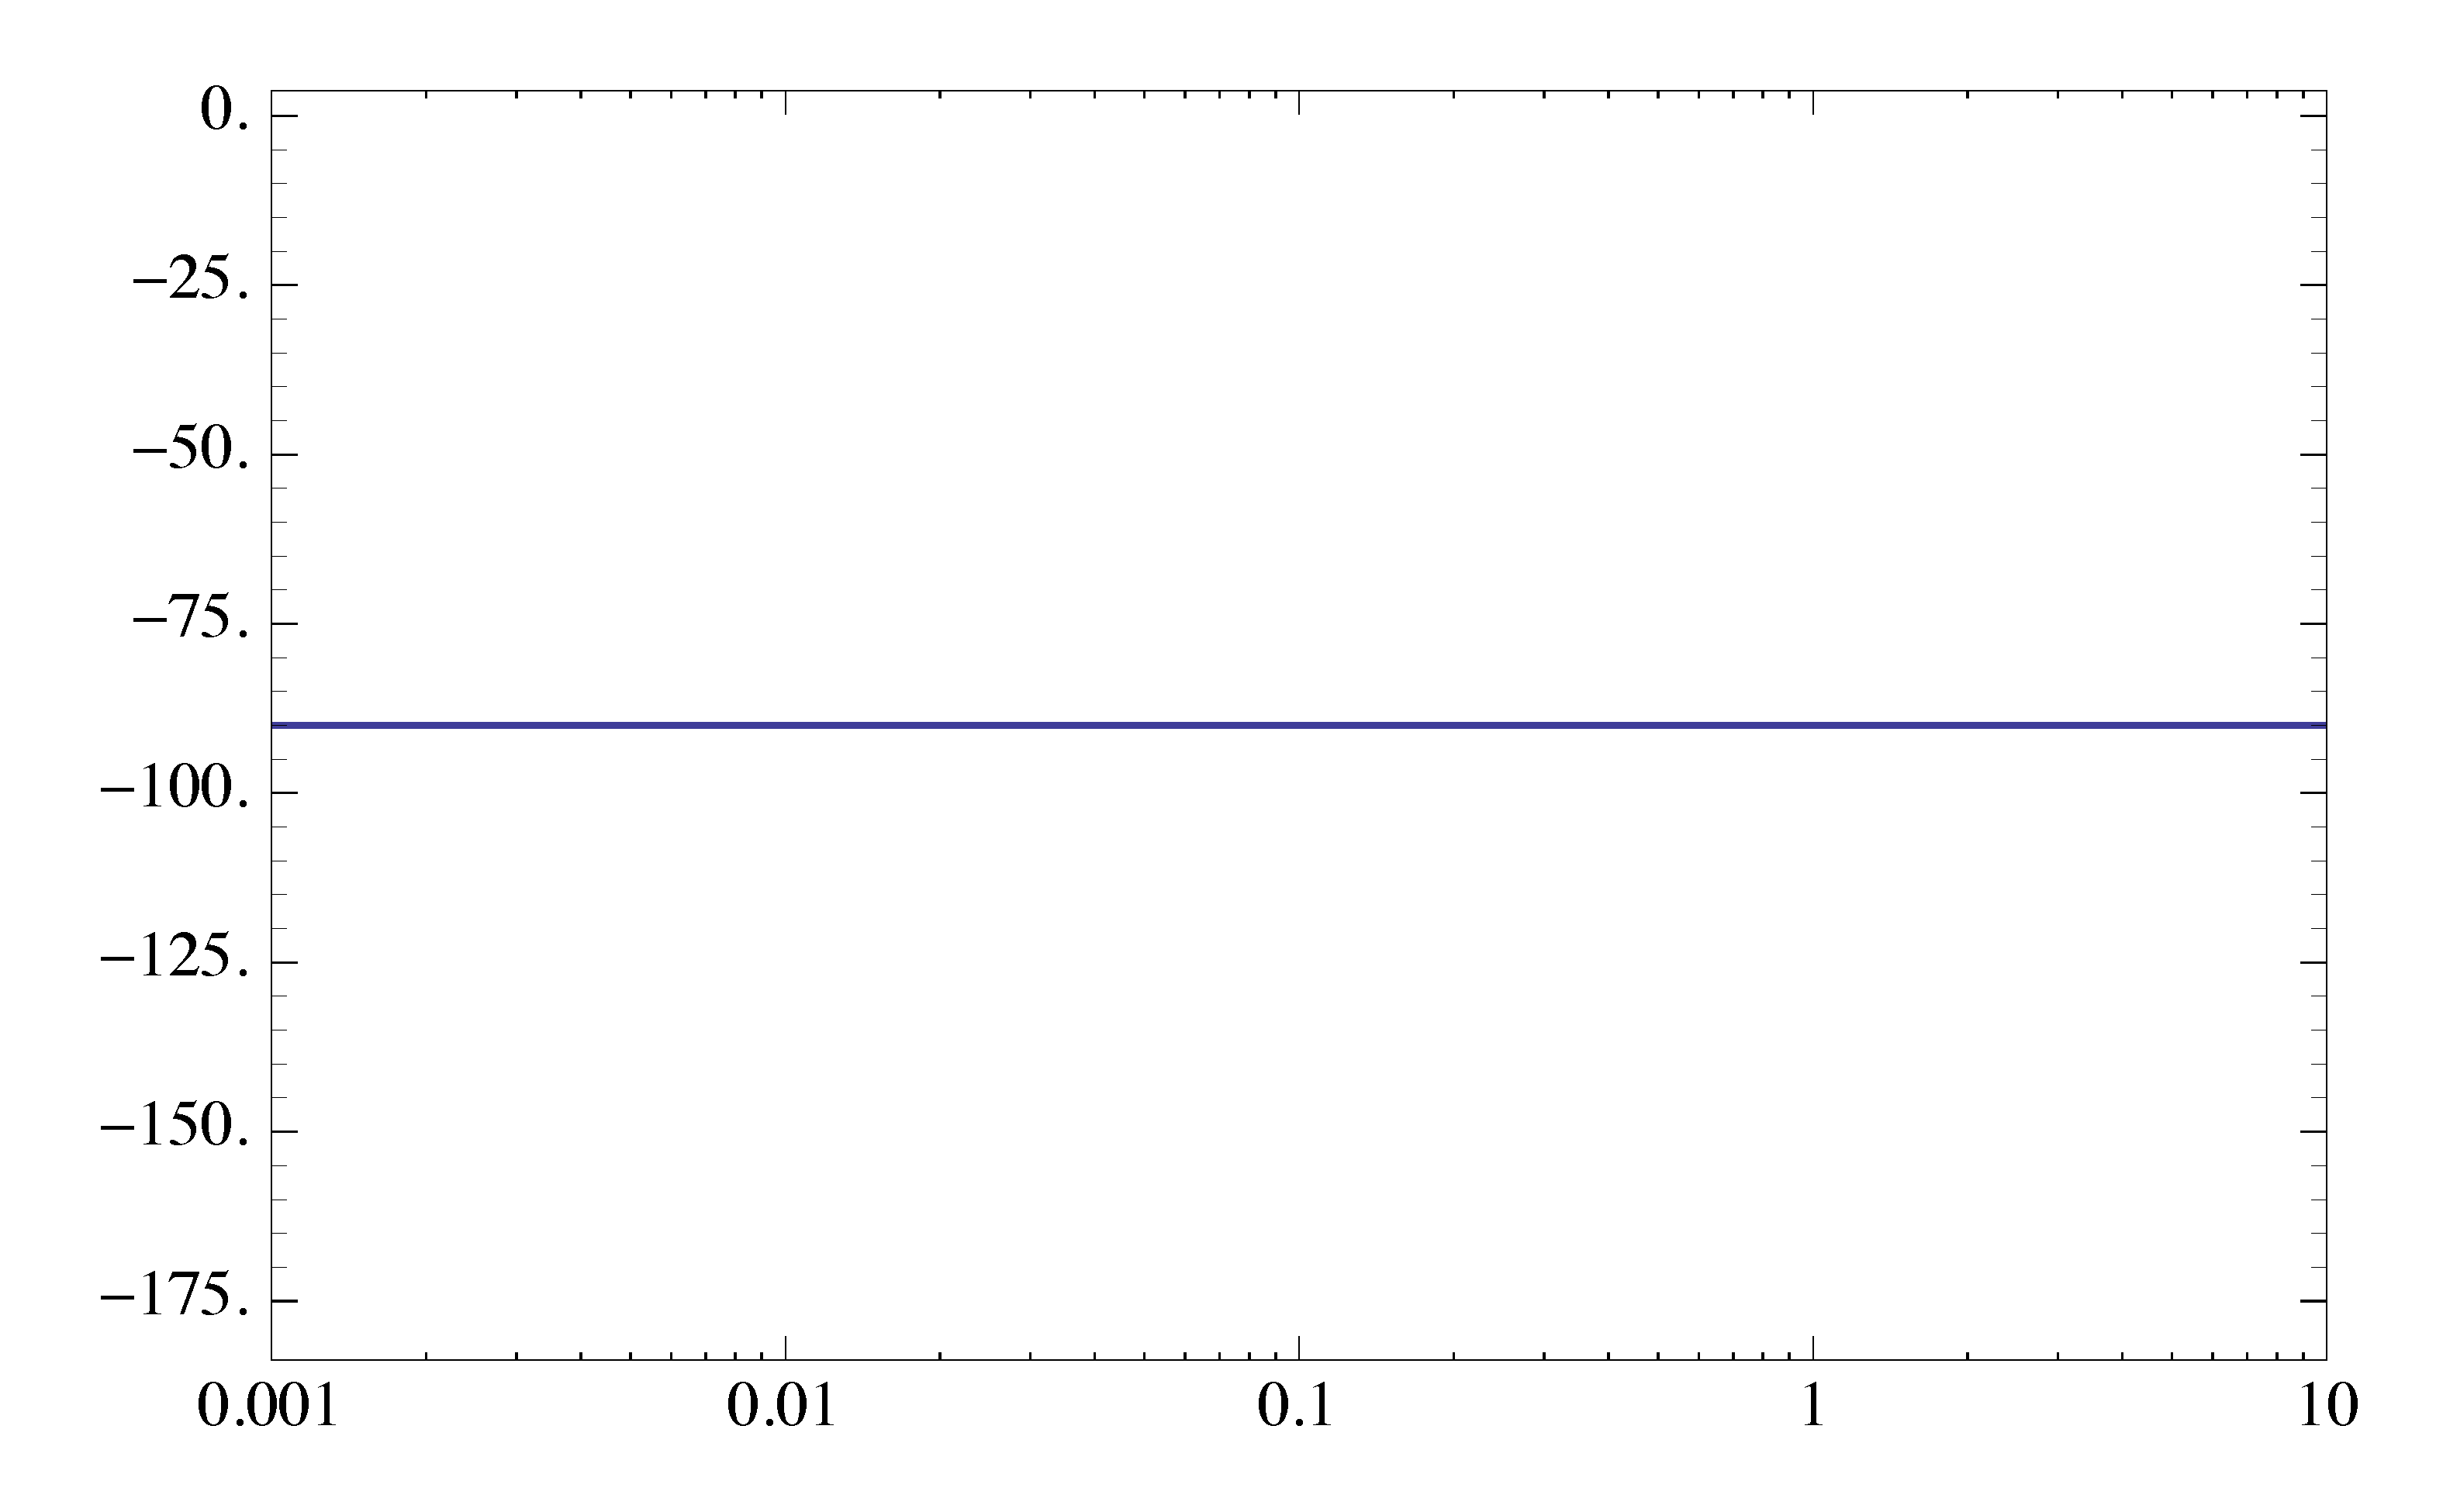
Figure 2: Phase plot of \(K_0(j\omega)^{-1}\)
Type 2: \(j\omega\tau + 1\)
This is the case of a stable real zero. To study \(|j\omega\tau+1|\) and \(\angle(j\omega\tau+1)\) as a function of \(\omega\), we will look at the Nyquist plot as shown in Figure 3.
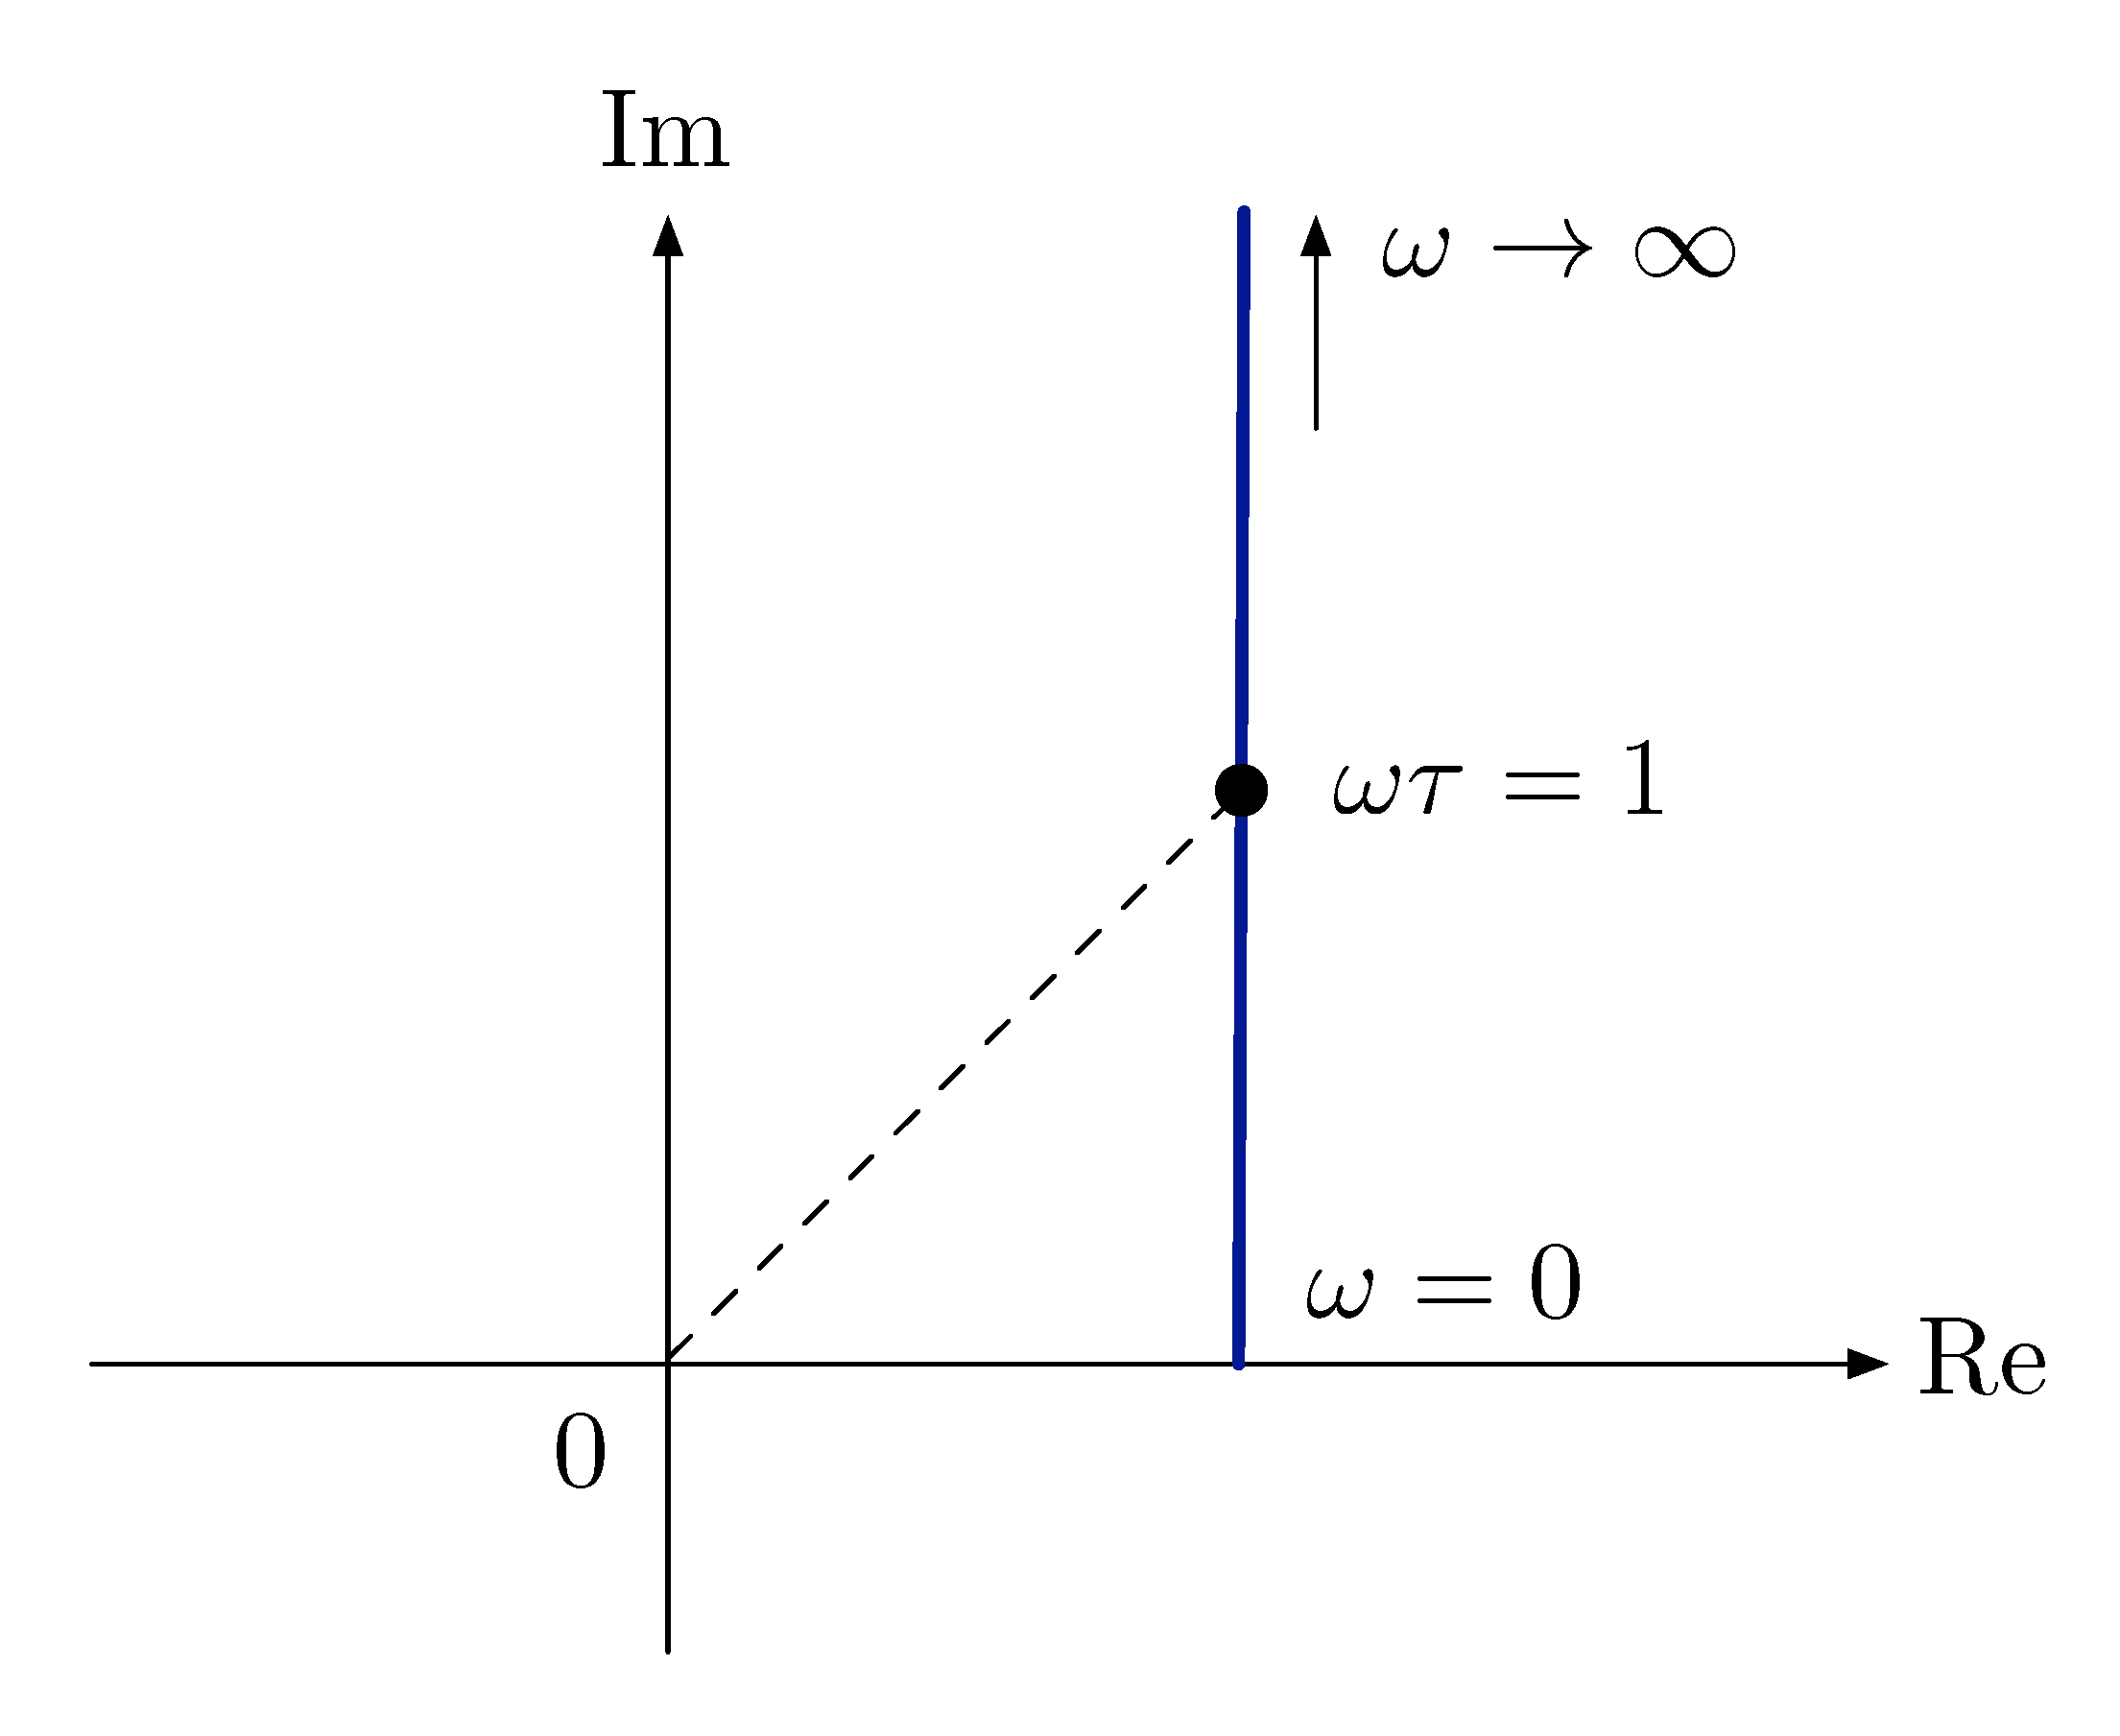
Figure 3: Nyquist plot of \(j\omega\tau + 1\)
- For \(\omega \tau \ll 1\), \(j\omega\tau + 1 \approx 1\).
- For \(\omega\tau \gg 1\), \(j\omega\tau + 1 \approx j\omega\tau\). In this case, Type 2 factor behaves like Type 1 with \(K_0 = \tau, n = 1\).
- The transition from one extreme to the other gives \(\omega\tau=1\, \Longleftrightarrow \, \omega = 1/\tau\). This frequency is the breakpoint frequency.
As for the magnitude plot,
- For small \(\omega\) below breakpoint, \(M \approx 1\), a horizontal line.
For large \(\omega\) above breakpoint,
\begin{align*} \log M &\approx \log |j\omega\tau| \\ &= \log \omega\tau \\ &= \log \tau + \log \omega. \end{align*}This gives a line of slope \(1\) passing through the point \((1/\tau,1)\) on a plot of \(\log\) - \(\log\) scale. Note these are just asymptotes; the actual value of \(M\) at \(\omega = 1/\tau\) is \(\sqrt{2}\).
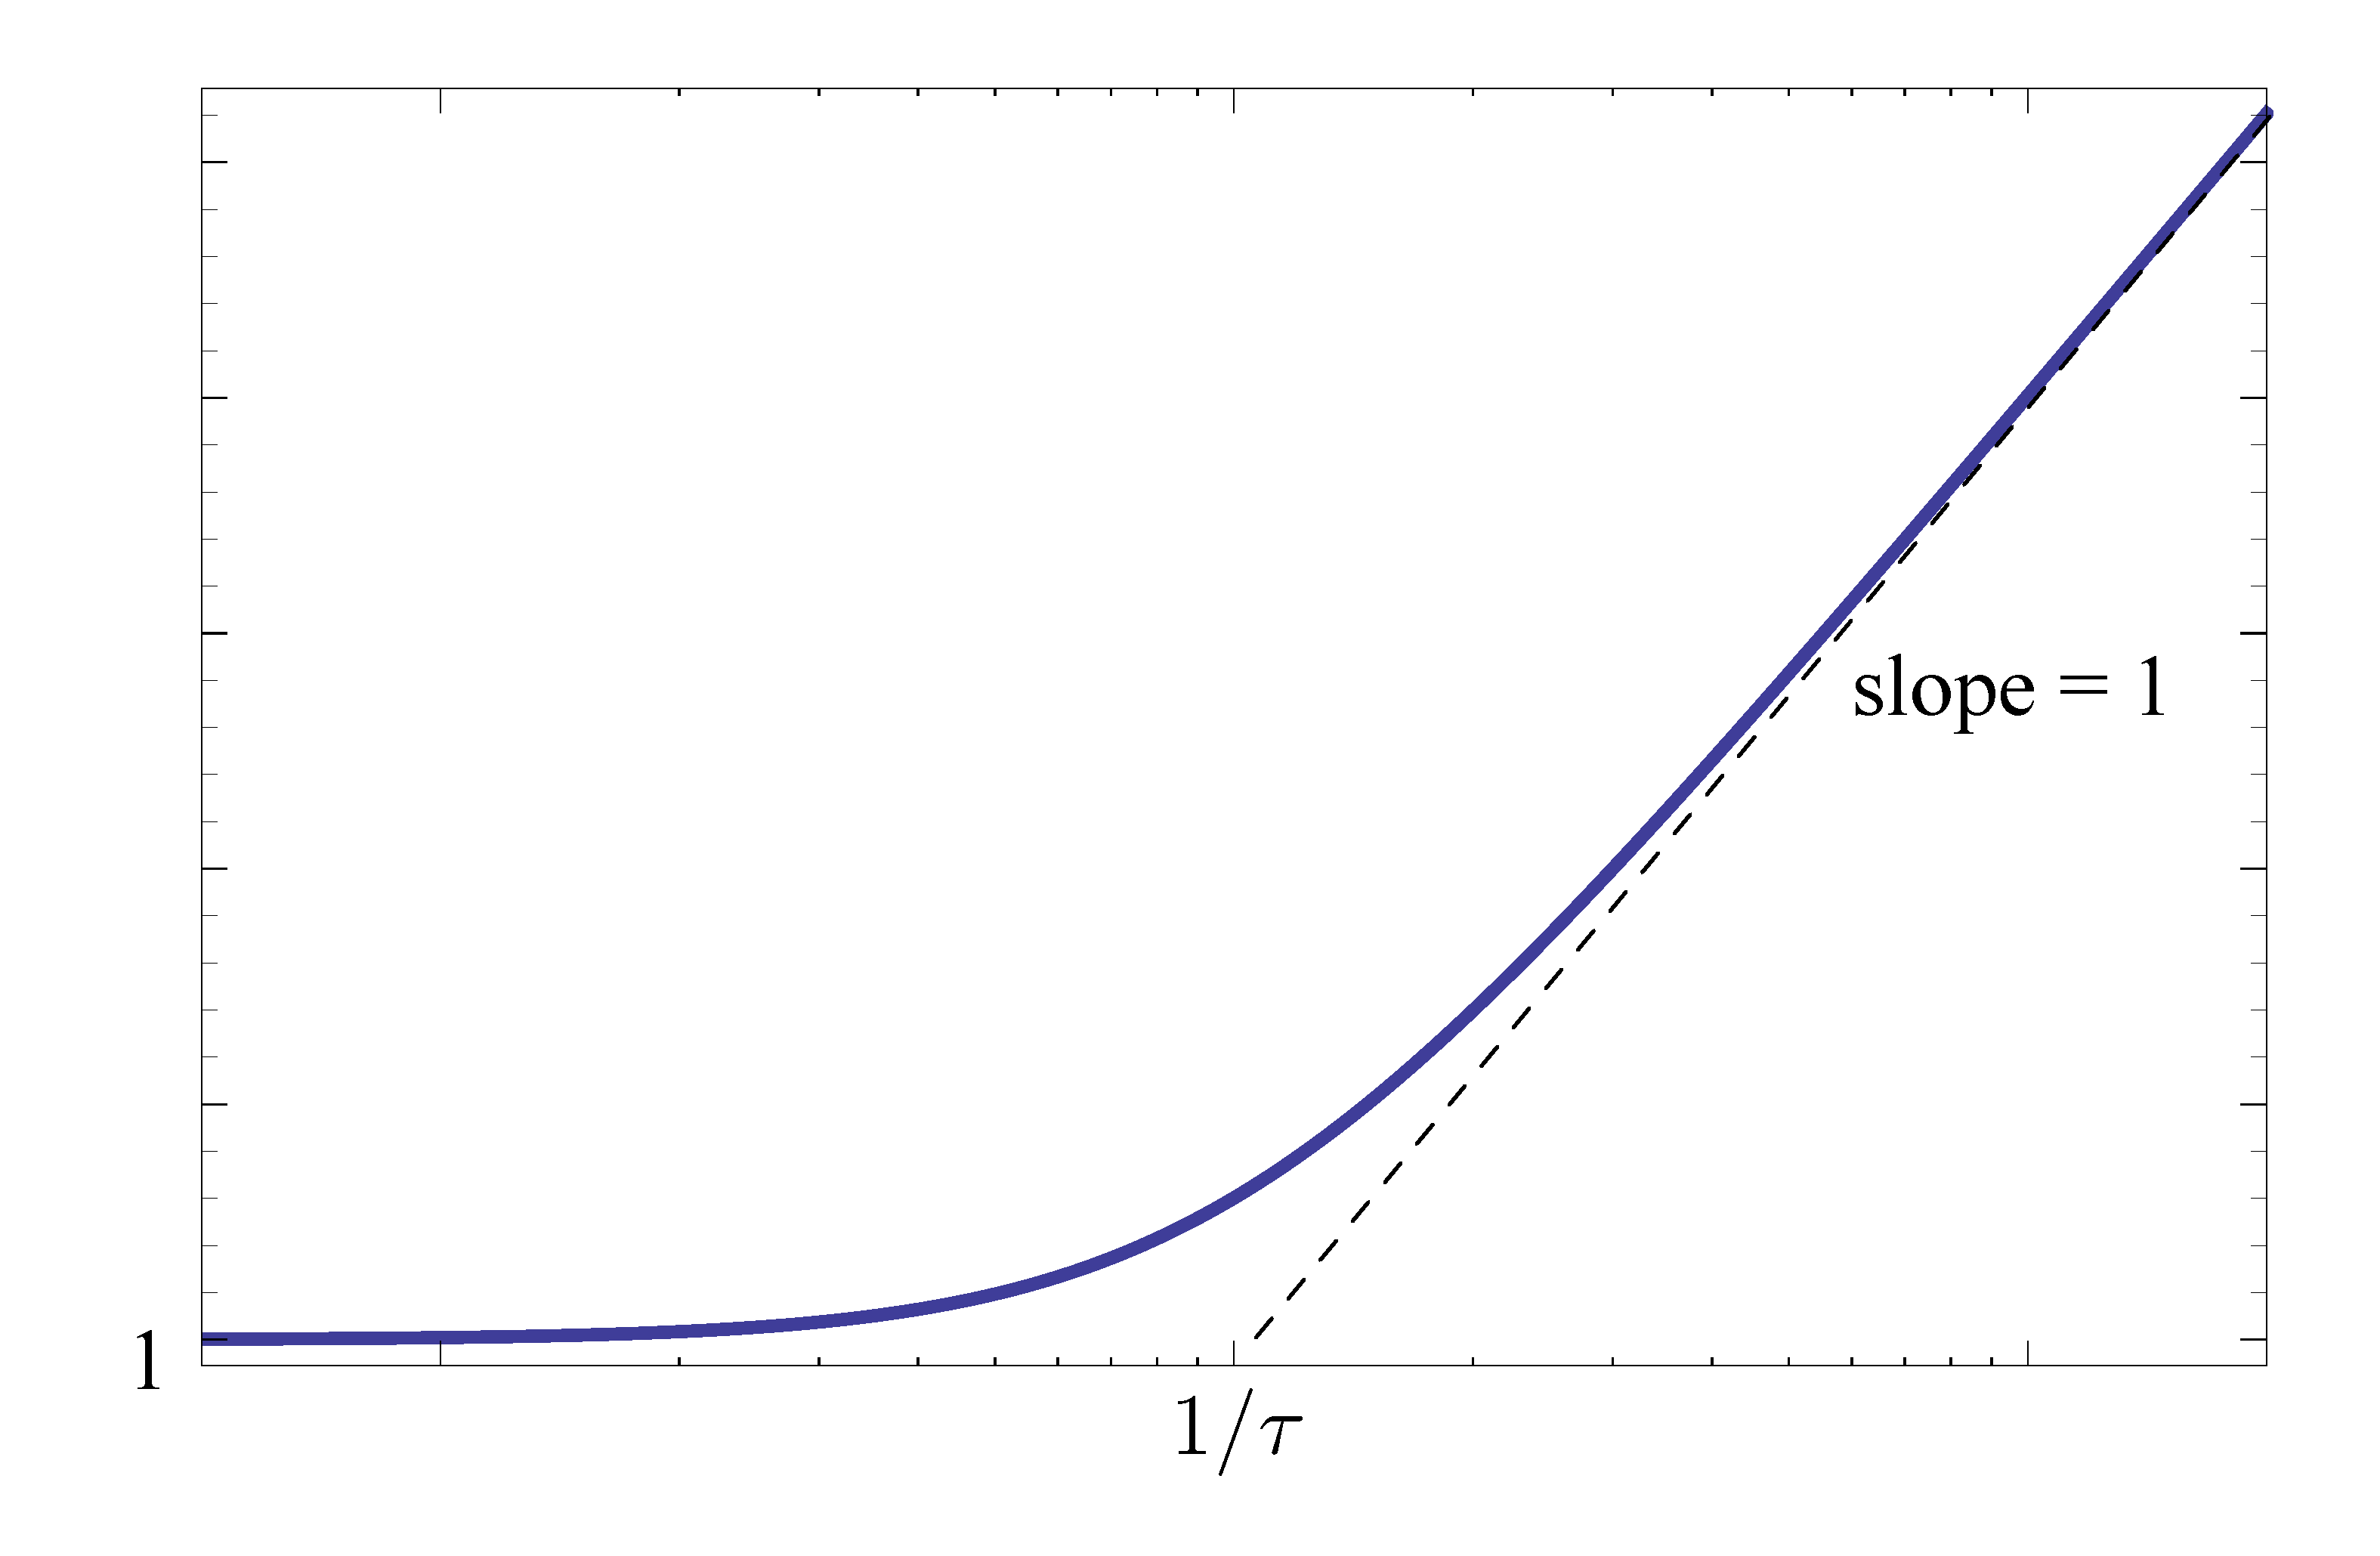
Figure 4: Magnitude plot of \(j\omega\tau + 1\)
Figure 4 shows for a stable real zero, the magnitude slope “steps up” by \(1\) at the breakpoint.
As for the phase plot, as shown in Figure 3,
- For small \(\omega\) (below breakpoint), \(\phi \approx 0^\circ\).
For large \(\omega\) (above breakpoint),
\begin{align*} \phi &\approx \angle(j\omega\tau) \\ &= 90^\circ. \end{align*}At breakpoint (\(\omega\tau=1\)),
\begin{align*} \phi &= \angle(j+1) \\ &= 45^\circ. \end{align*}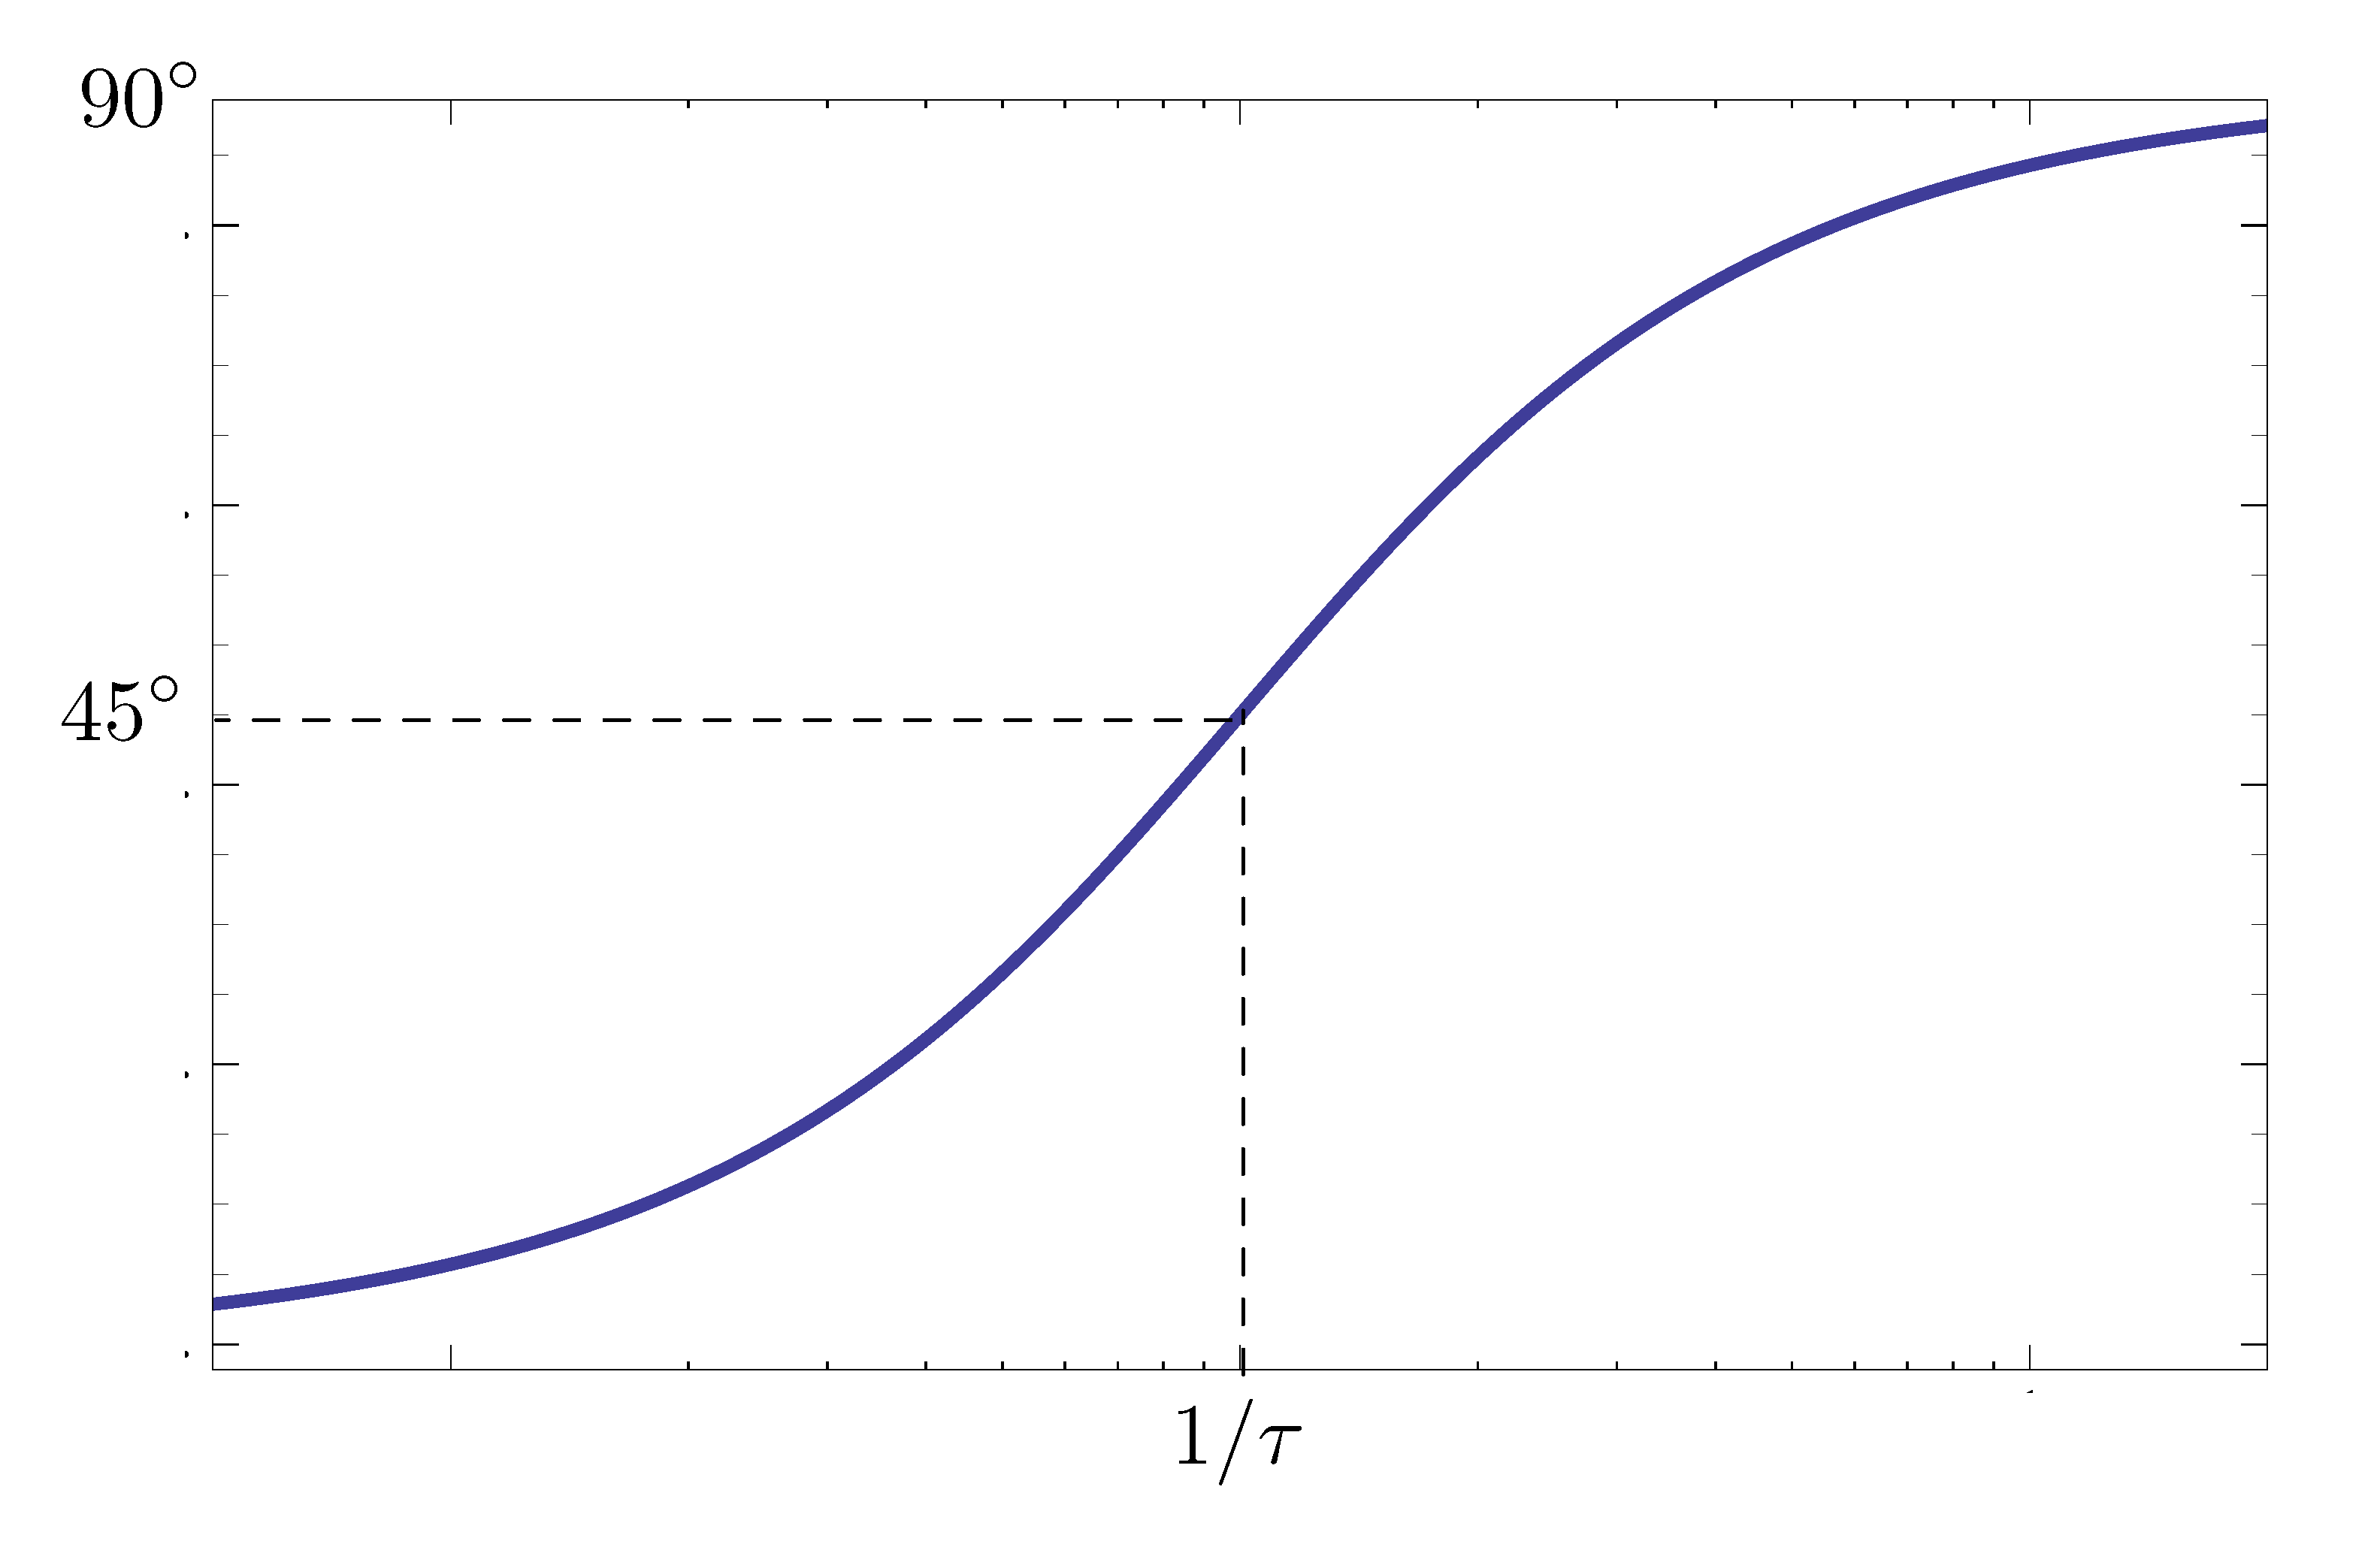
Figure 5: Phase plot of \(j\omega\tau + 1\)
Figure 5 shows for a stable real zero, the phase “steps up” by \(90^\circ\) as we go past the breakpoint.
Type 2: \((j\omega\tau+1)^{-1}\)
Since this type of factor is the inverse of the one we just discussed, this is a case of a stable real pole.
Its magnitude
\begin{align*} \log \left|\frac{1}{j\omega\tau+1}\right| = -\log \left|j\omega\tau+1\right|, \end{align*}and its phase
\begin{align*} \angle \frac{1}{j\omega\tau+1} = -\angle (j\omega\tau+1). \end{align*}Therefore the magnitude and phase plots for a stable real pole are the reflections of the corresponding plots for the stable real zero with respect to the horizontal axis,
- at breakpoint frequency, its magnitude plot “step down” by \(1\) in magnitude slope and
- its phase plot “step down” by \(90^\circ\).
Example 1: Bode plot of a transfer function made up of Type 1 and Type 2 Factors. Consider the following open loop transfer function
\[ KG(s) = \frac{2000(s+\color{red}{0.5})}{s(s+\color{green}{10})(s+\color{blue}{50})}. \] Sketch the Bode plot for \(KG(s)\).
Solution: First off, convert the given open loop transfer function to Bode form
\begin{align*} KG(j\omega) &= \frac{2000 \cdot \color{red}{0.5} \cdot \left(\dfrac{j\omega}{\color{red}{0.5}}+1\right)}{\color{green}{10} \cdot \color{blue}{50} \cdot j\omega \left(\dfrac{j\omega}{\color{green}{10}}+1\right)\left(\dfrac{j\omega}{\color{blue}{50}}+1\right)} \\ &= \dfrac{2}{j\omega} \cdot \left(\dfrac{j\omega}{\color{red}{0.5}} + 1\right) \cdot \dfrac{1}{\left(\dfrac{j\omega}{\color{green}{10}}+1\right)\left(\dfrac{j\omega}{\color{blue}{50}}+1\right)}. \end{align*}Now consider the magnitude plot of the transfer function in Bode form
\begin{align*} KG(j\omega) &= \dfrac{2}{j\omega} \cdot \left(\dfrac{j\omega}{\color{red}{0.5}} + 1\right) \cdot \dfrac{1}{\left(\dfrac{j\omega}{\color{green}{10}}+1\right)\left(\dfrac{j\omega}{\color{blue}{50}}+1\right)}. \end{align*}It has one factor of Type 1, where
- \(K_0 = 2, n=-1\). It contributes a line of slope \(-1\) passing through the point \((\omega,M) = (1, 2)\).
- This is a low-frequency asymptote: for small \(\omega\), it gives very large values of \(M\), while other terms for small \(\omega\) are close to \(M=1\) since \(\log 1 = 0\).
It has three factors of Type 2. We can mark the breakpoints from Type 2 terms,
- \(\omega = 0.5\) in the first Type 2 factor of a stable zero, it makes the slope step up by \(1\).
- \(\omega = 10\) in the second Type 2 factor of a stable pole, it makes the slope step down by \(1\).
- \(\omega = 50\) in the third Type 2 factor of a stable pole, it makes the slope step down by \(1\).
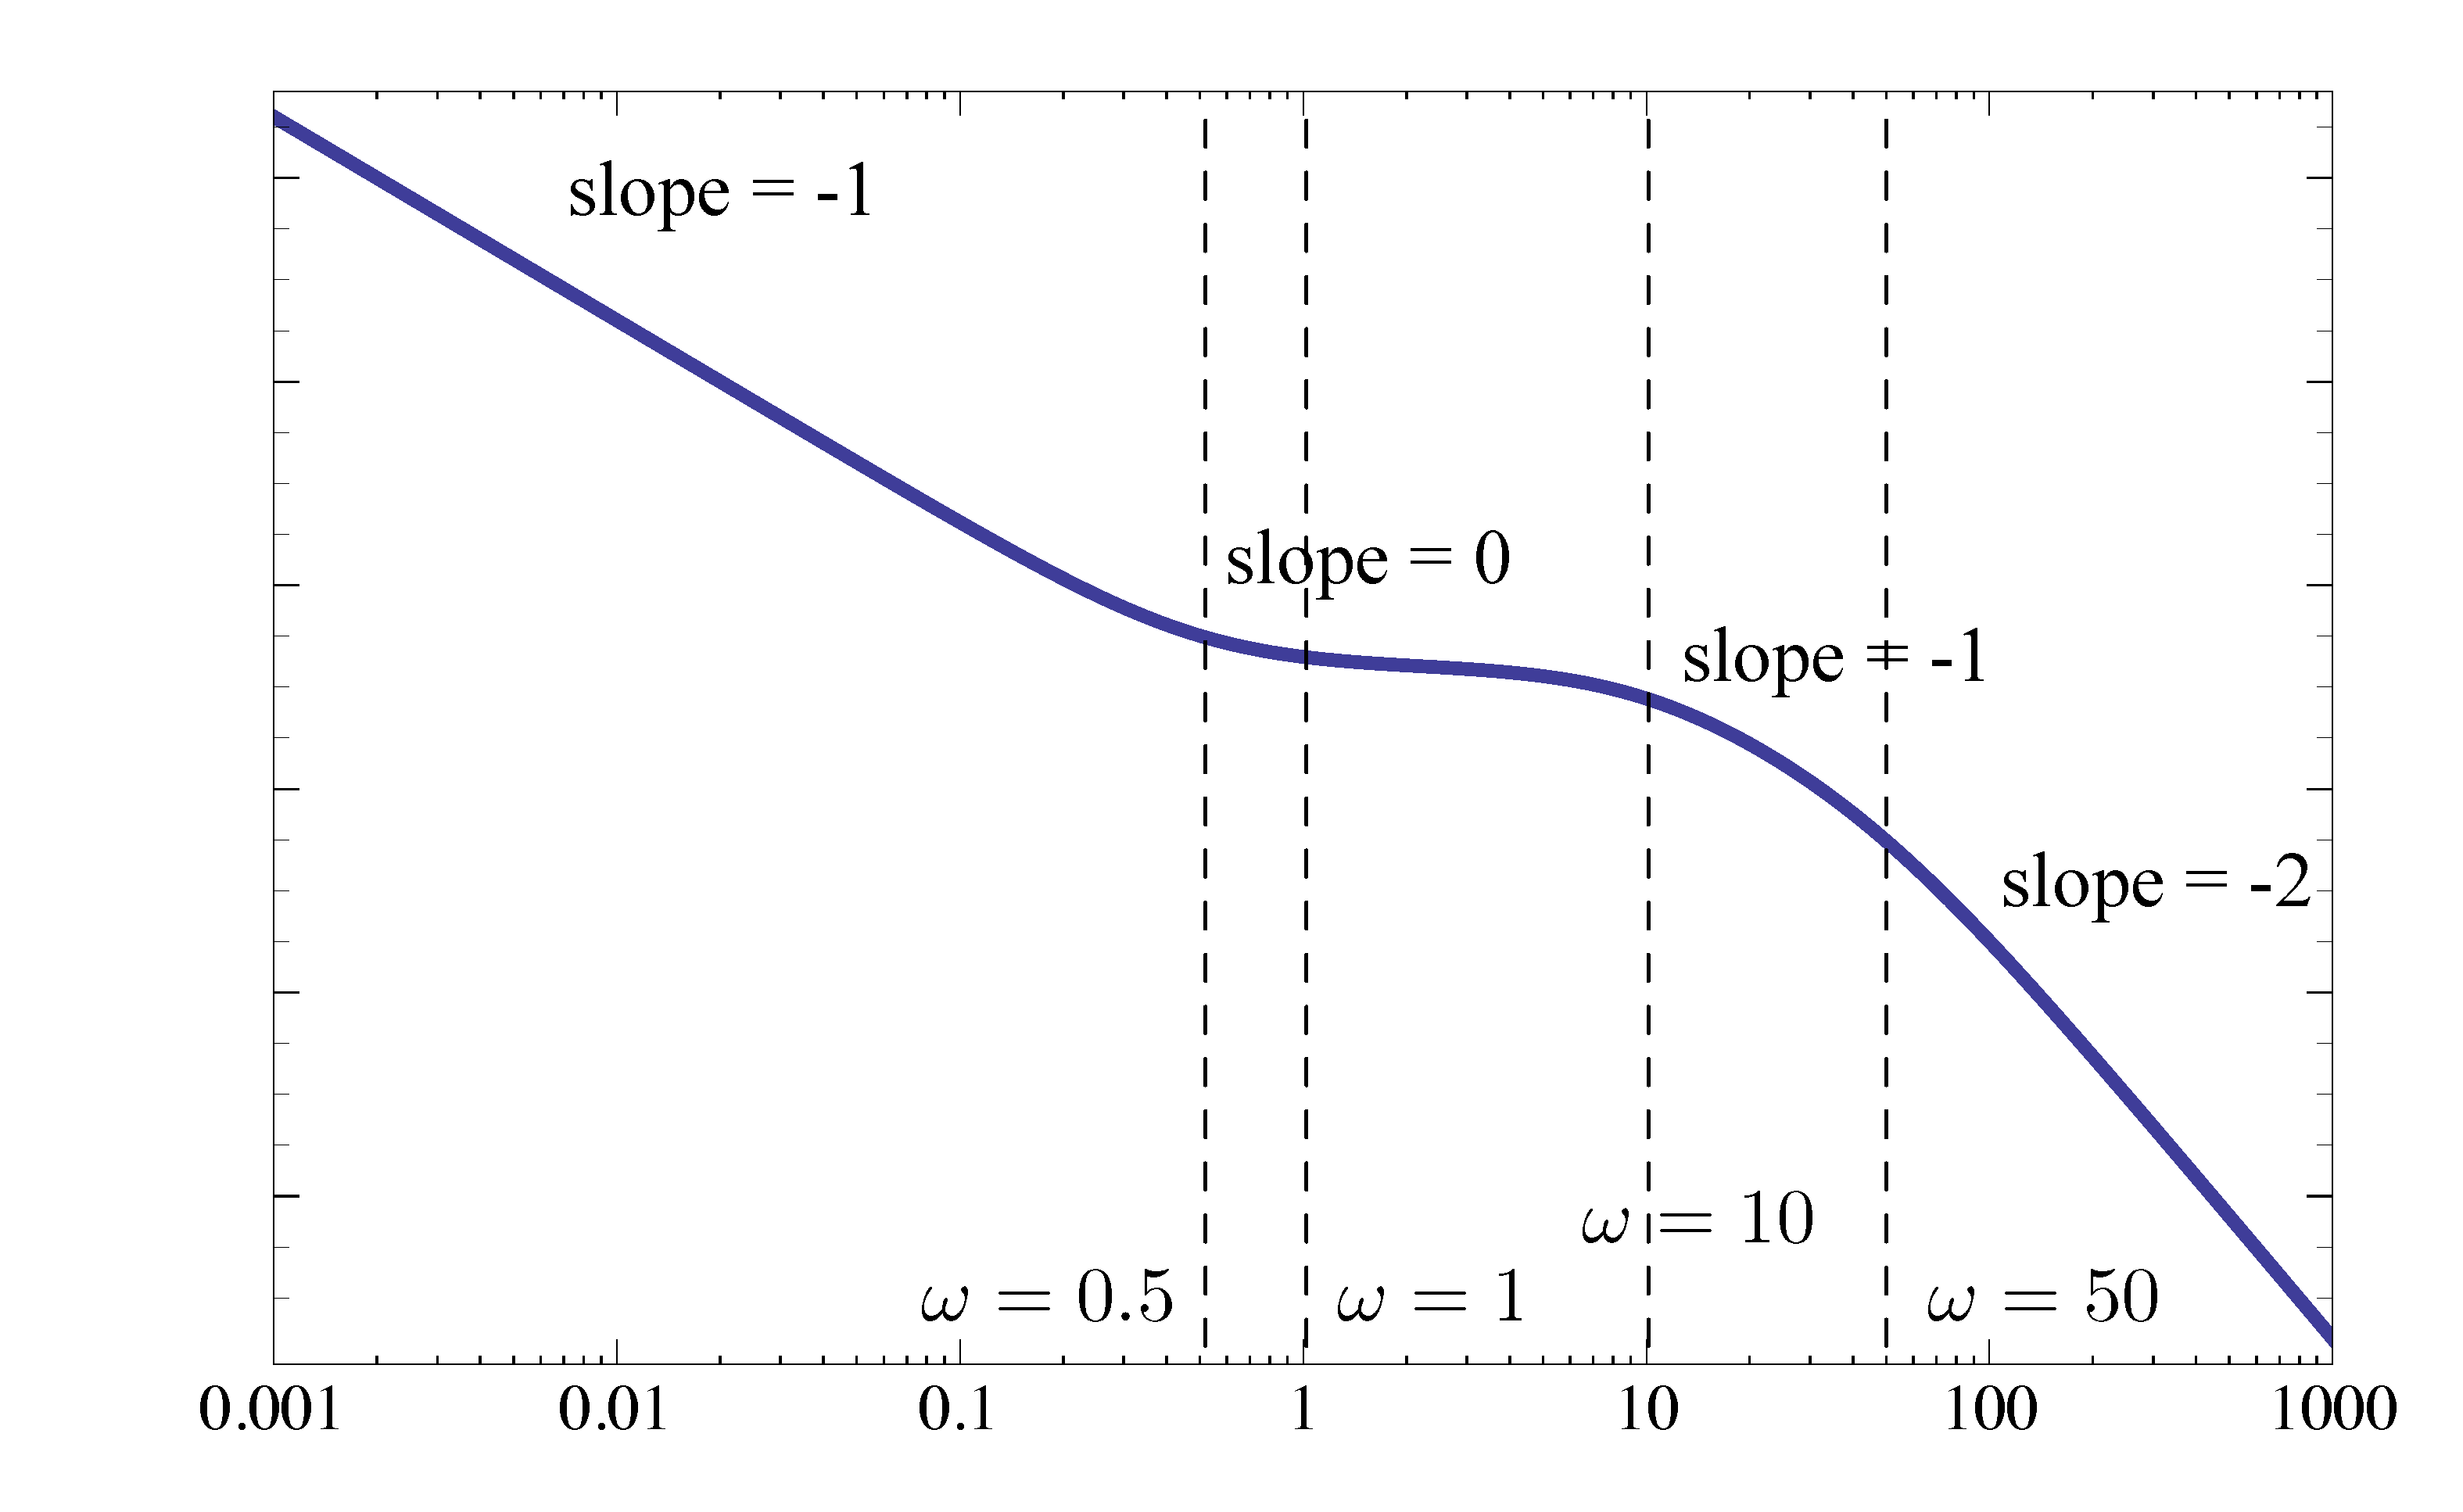
Figure 6: Magnitude plot of \(KG(s)\)
Now consider its phase plot.
Type 1 factor where
- \(n=-1\), makes phase start at \(-90^\circ\).
Type 2 factors
- \(\omega = 0.5\) in the case of a stable zero, total phase goes up by \(90^\circ\); at \(\omega = 0.5\) phase up by \(45^\circ\).
- \(\omega = 10\) in the case of a stable pole, total phase goes down by \(90^\circ\); at \(\omega = 10\) phase down by \(45^\circ\).
- \(\omega = 50\) in the case of a stable pole, total phase goes down by \(90^\circ\); at \(\omega = 50\) phase down by \(45^\circ\).
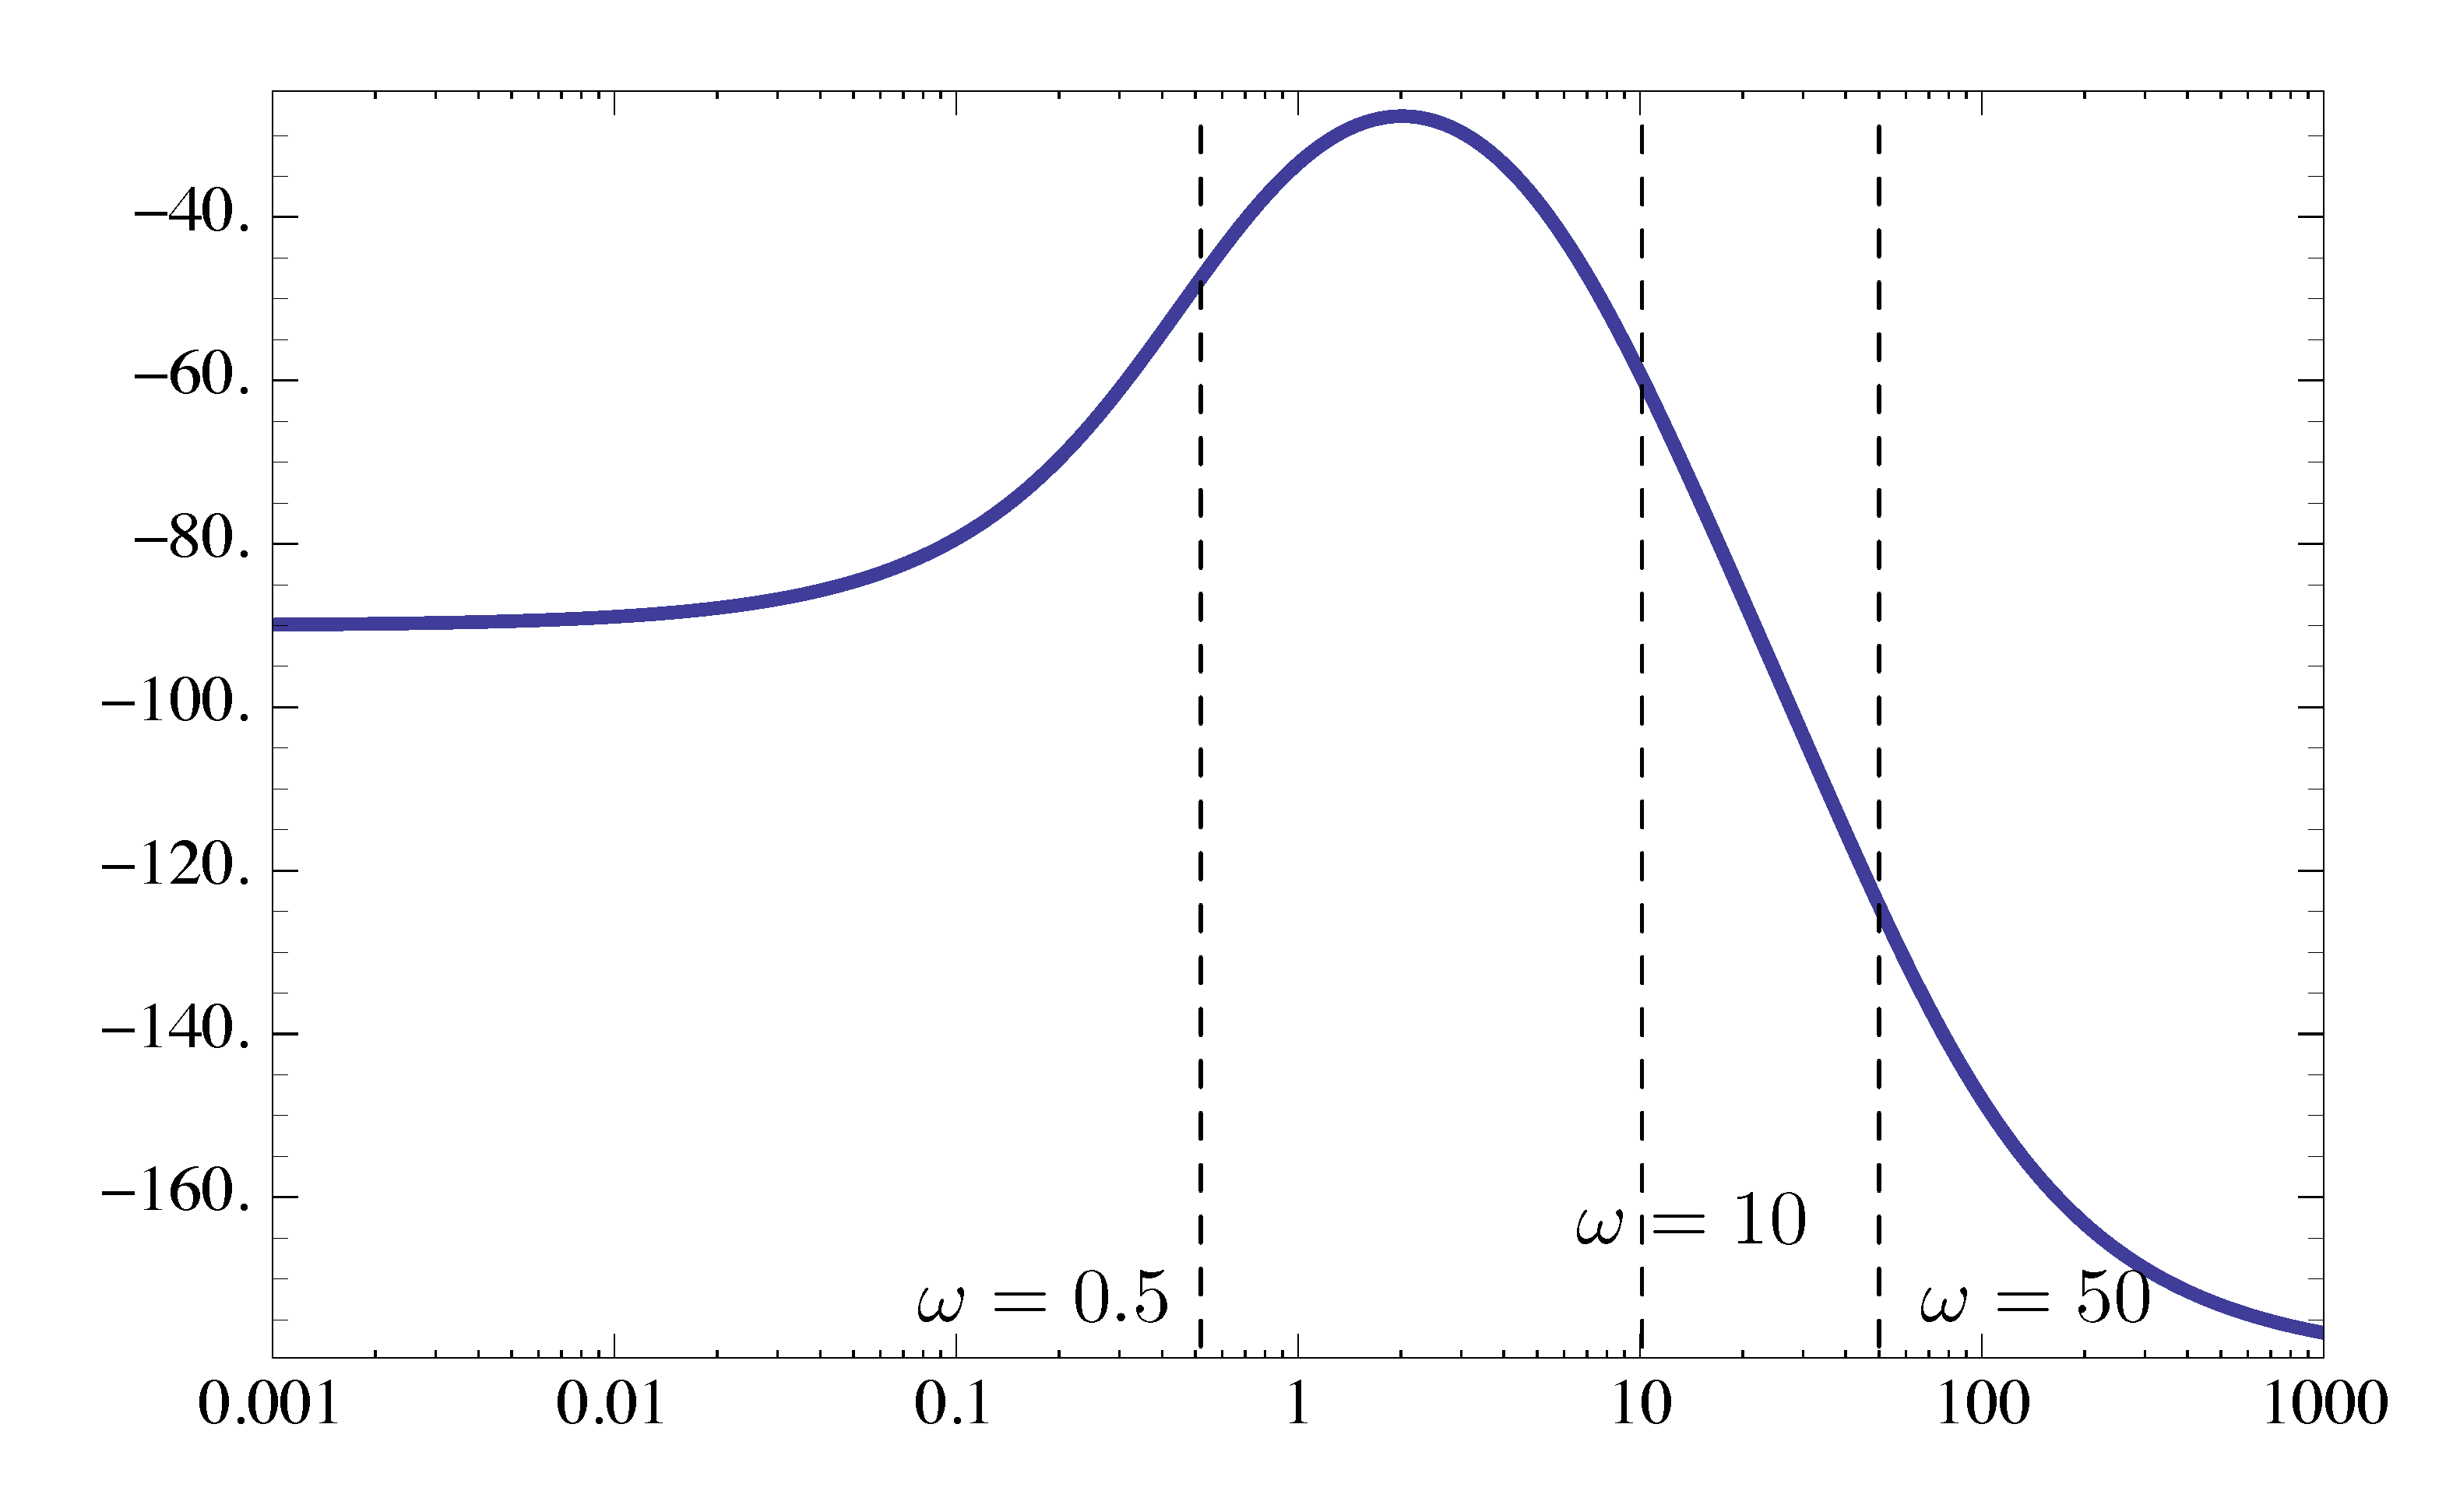
Figure 7: Phase plot of \(KG(s)\)
Type 3: \(\left(\frac{j\omega}{\omega_n}\right)^2 + 2\zeta \frac{j\omega}{\omega_n} + 1\)
The factor of Type 3 gives stable complex zeros. As our first step, rewrite it in Cartesian form,
\begin{align*} \tag{1} \label{d14_eq1} \left(\frac{j\omega}{\omega_n}\right)^2 + 2\zeta \frac{j\omega}{\omega_n} + 1 = \underbrace{\left(1- \left(\frac{\omega}{\omega_n}\right)^2\right)}_{\text{real part}} + \underbrace{2\zeta\frac{\omega}{\omega_n}}_{\text{imag. part}}j. \end{align*}Figure 8 below is the Nyquist plot for \(0 < \omega < \infty\).
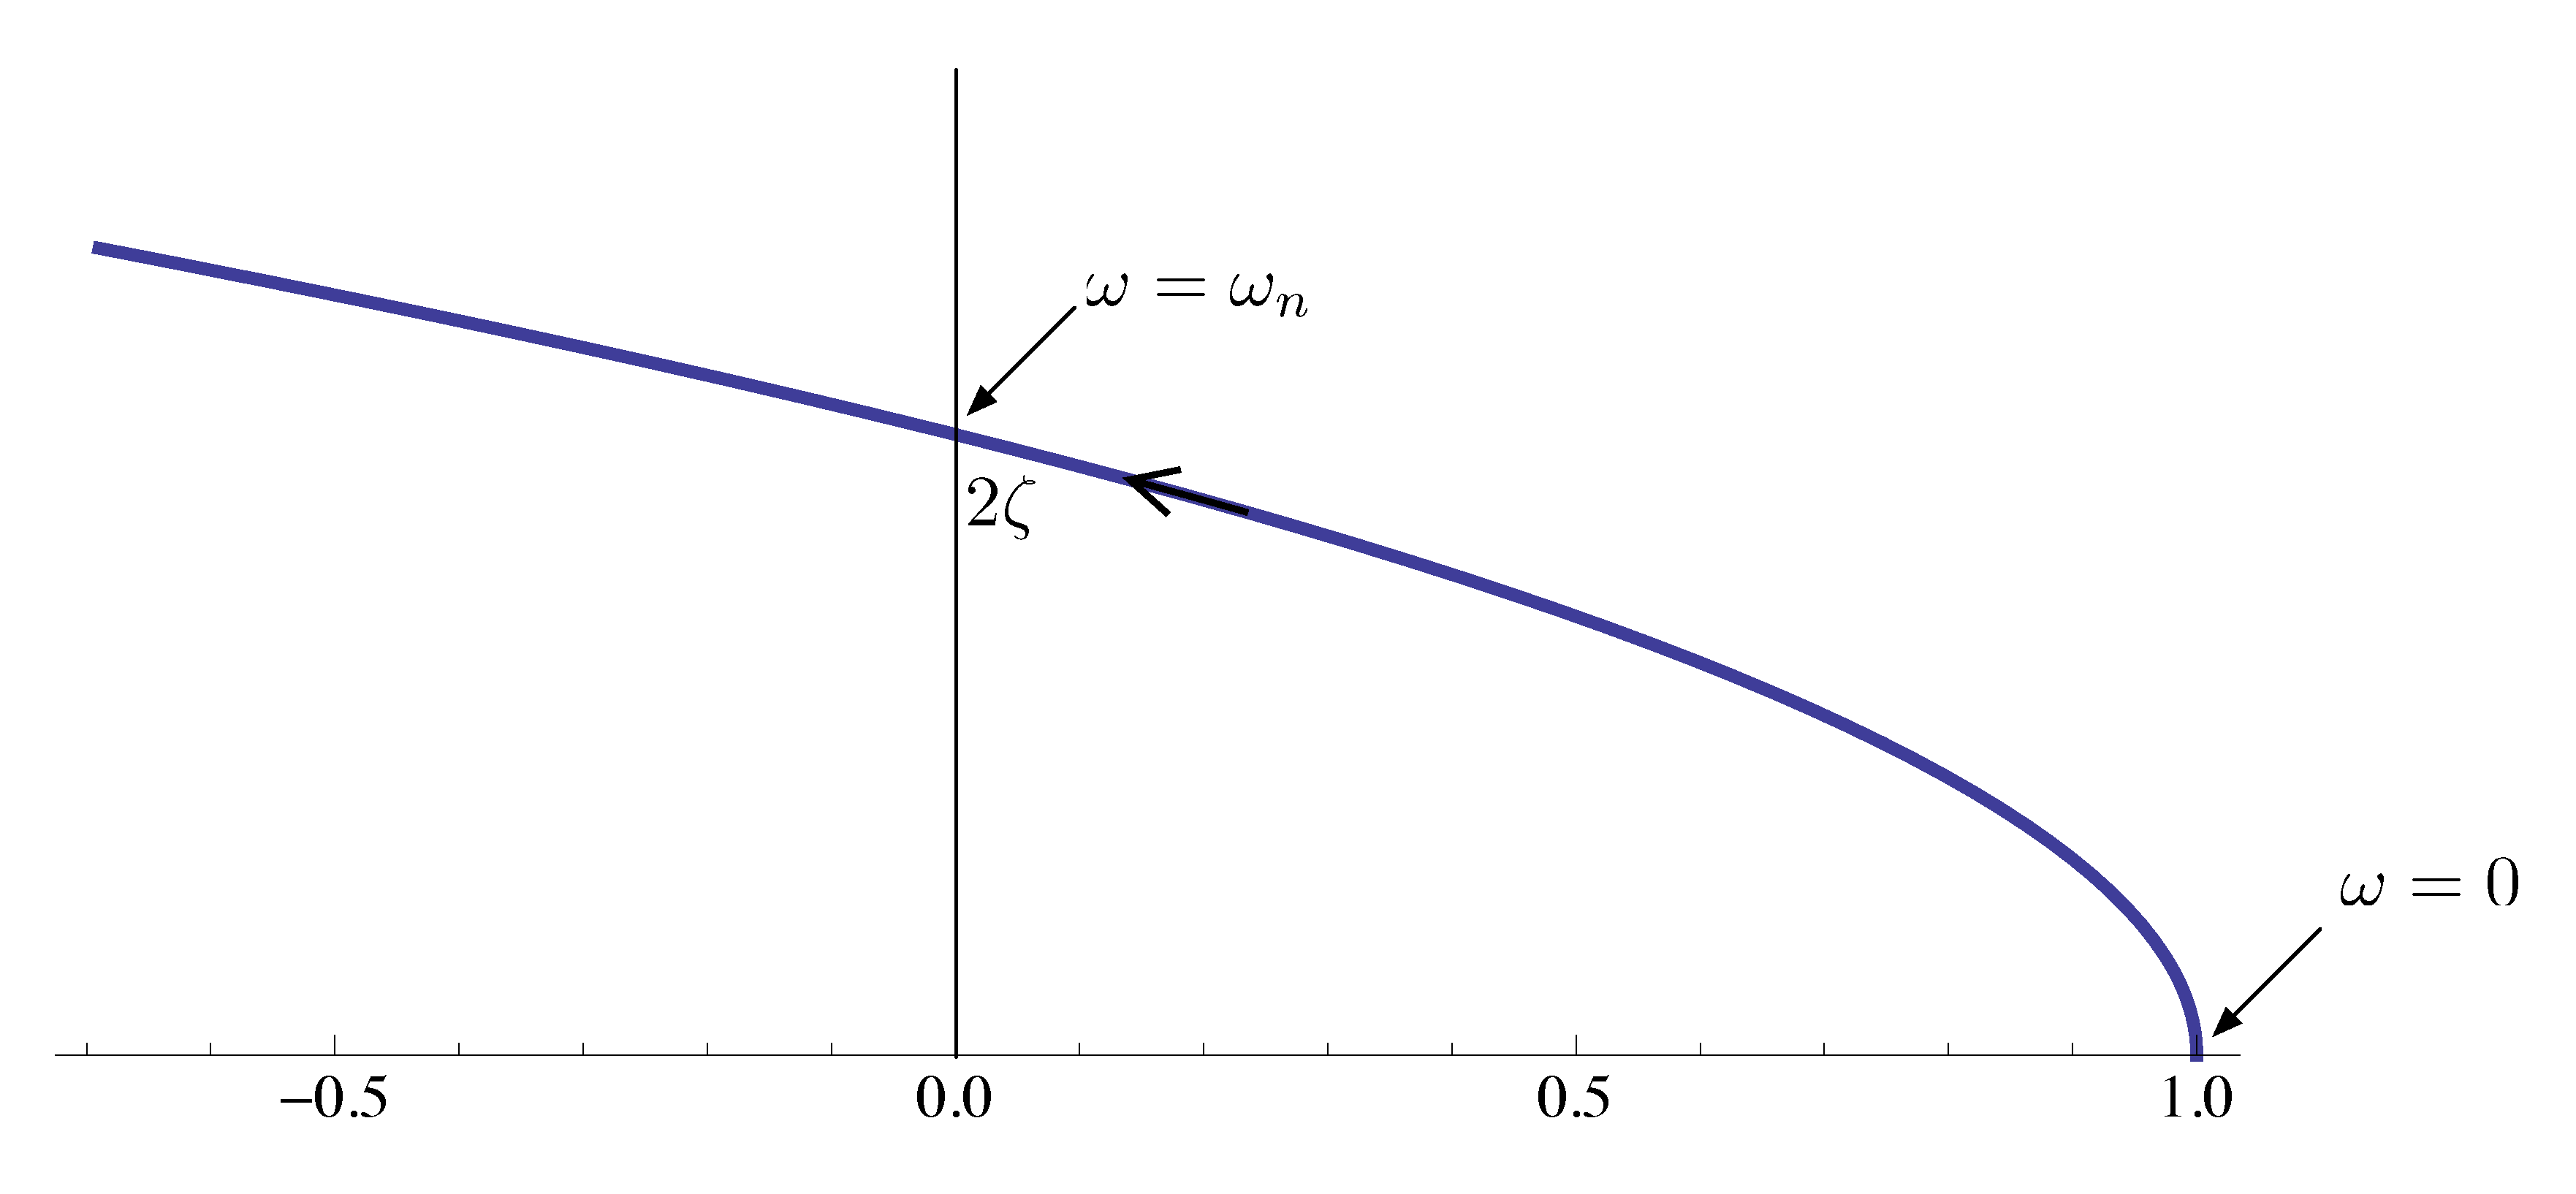
Figure 8: Nyquist plot of factor of Type 3, \(0 < \omega < \infty\)
A quick observation here is when \(\omega = 0\), The Nyquist plot starts at \(1 + 0j\); when \(\omega = \omega_n\), Nyquist plot passes through \(0 + 2\zeta j\).
When \(\omega \to \infty\), we have
- the real part in Equation \eqref{d14_eq1}, \(\left(1- \left(\frac{\omega}{\omega_n}\right)^2\right) \approx - (\omega/\omega_n)^2 \to - \infty\), quadratic in \(\omega\);
- the imaginary part \(2\zeta\frac{\omega}{\omega_n} = (2\zeta \frac{1}{\omega_n})\omega \to \infty\), linear in \(\omega\).
Now we can begin plotting its magnitude plot.
- for small frequencies \(\omega \ll \omega_n\), \(M \approx 1 \implies \log M = 0\), resulting in a horizontal line;
- for large frequencies \(\omega \gg \omega_n\), \(M \approx \left(\frac{\omega}{\omega_n}\right)^2 \implies \log M \approx 2 \log \omega - 2 \log \omega_n\). In this case, the asymptote is a line of slope \(2\) passing through the point \((\omega, M) = (\omega_n, 1)\).
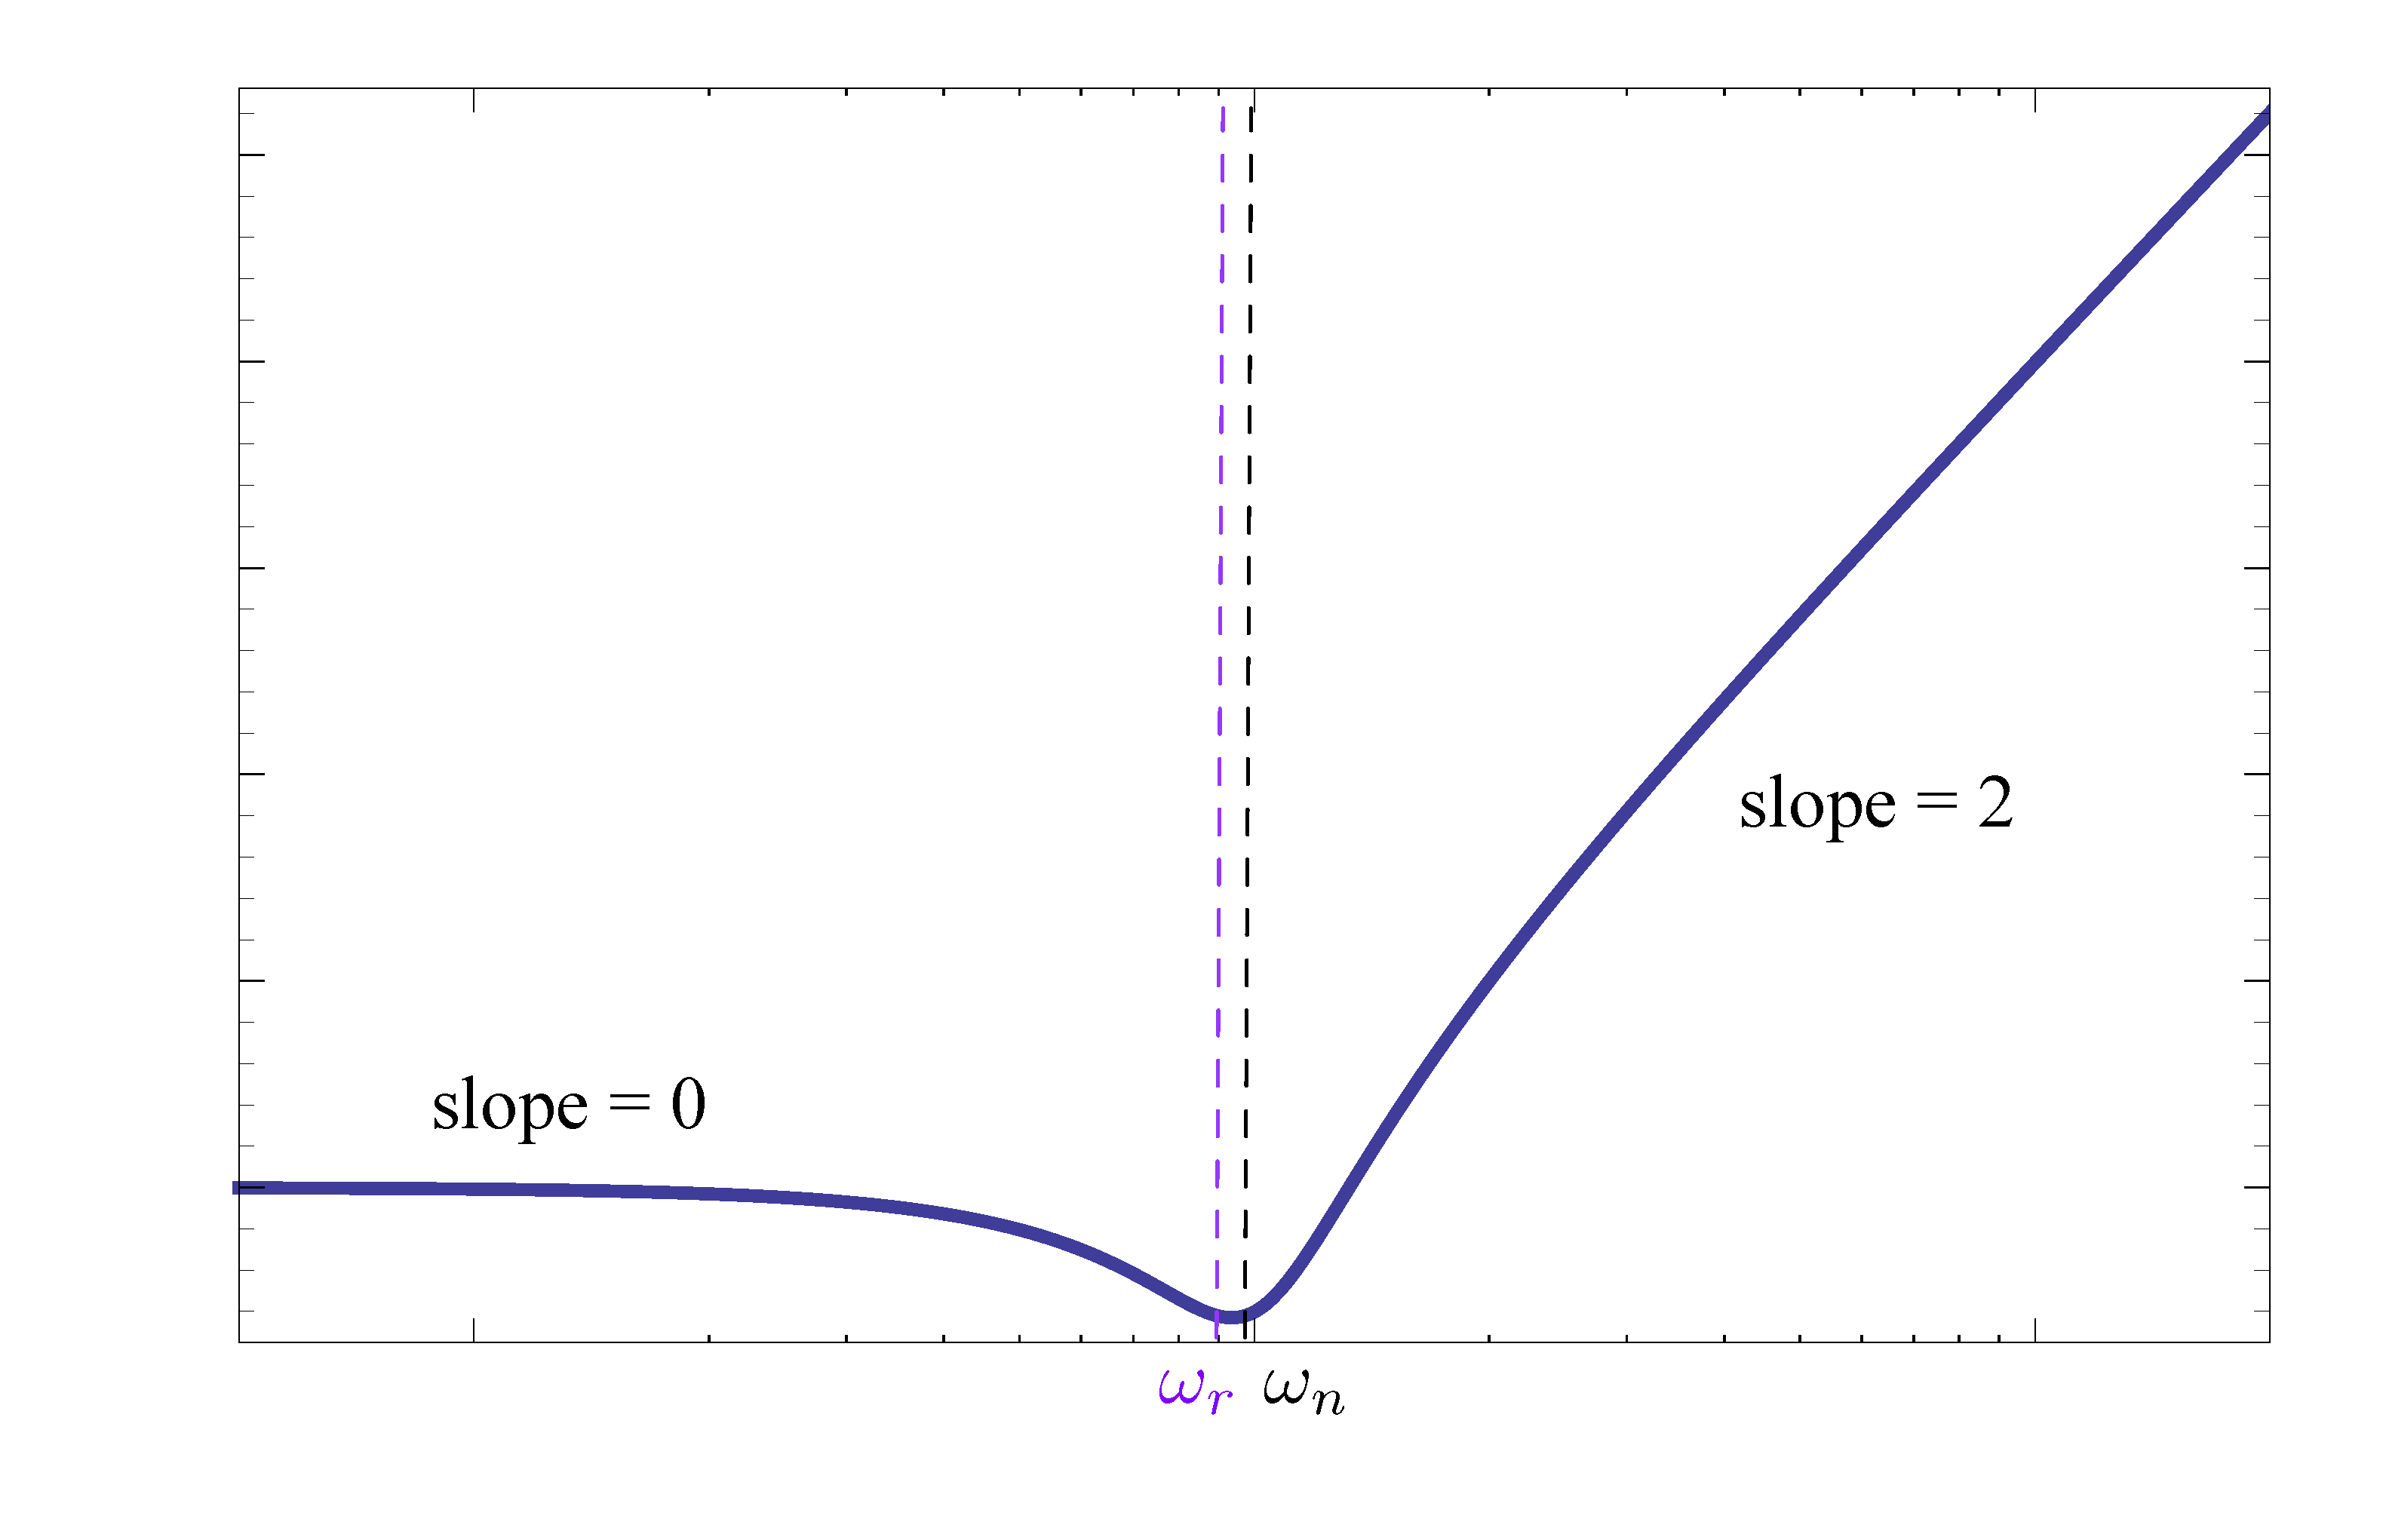
Figure 9: Magnitude plot of factor of Type 3 (stable zeros)
Therefore, for factor of Type 3 of a stable complex zero, the magnitude slope “steps up” by \(2\) as we go through the breakpoint.
The discussion of its phase plot will be combined with the case of its inverse below.
Type 3: \(\left[\left(\frac{j\omega}{\omega_n}\right)^2 + 2\zeta \frac{j\omega}{\omega_n} + 1\right]^{-1}\)
Similar to what we did to the discussion of Type 2 factors, this case is the inverse of the Type 3 factor we just investigated. It is a case of stable complex poles.
Its magnitude
\begin{align*} \log M &= \log \left|\frac{1}{\left(\frac{j\omega}{\omega_n}\right)^2 + 2\zeta \frac{j\omega}{\omega_n} + 1}\right| \\ &= -\log \left|\left(\frac{j\omega}{\omega_n}\right)^2 + 2\zeta \frac{j\omega}{\omega_n} + 1\right|. \\ \end{align*}Its phase
\begin{align*} \phi &= \angle \frac{1}{\left(\frac{j\omega}{\omega_n}\right)^2 + 2\zeta \frac{j\omega}{\omega_n} + 1} \\ &= - \angle \left[\left(\frac{j\omega}{\omega_n}\right)^2 + 2\zeta \frac{j\omega}{\omega_n} + 1\right]. \end{align*}Recall from last time, its magnitude plot (in $M(ω)$-\(\frac{\omega}{\omega_n}\) plane) depends on the value of \(\zeta\).
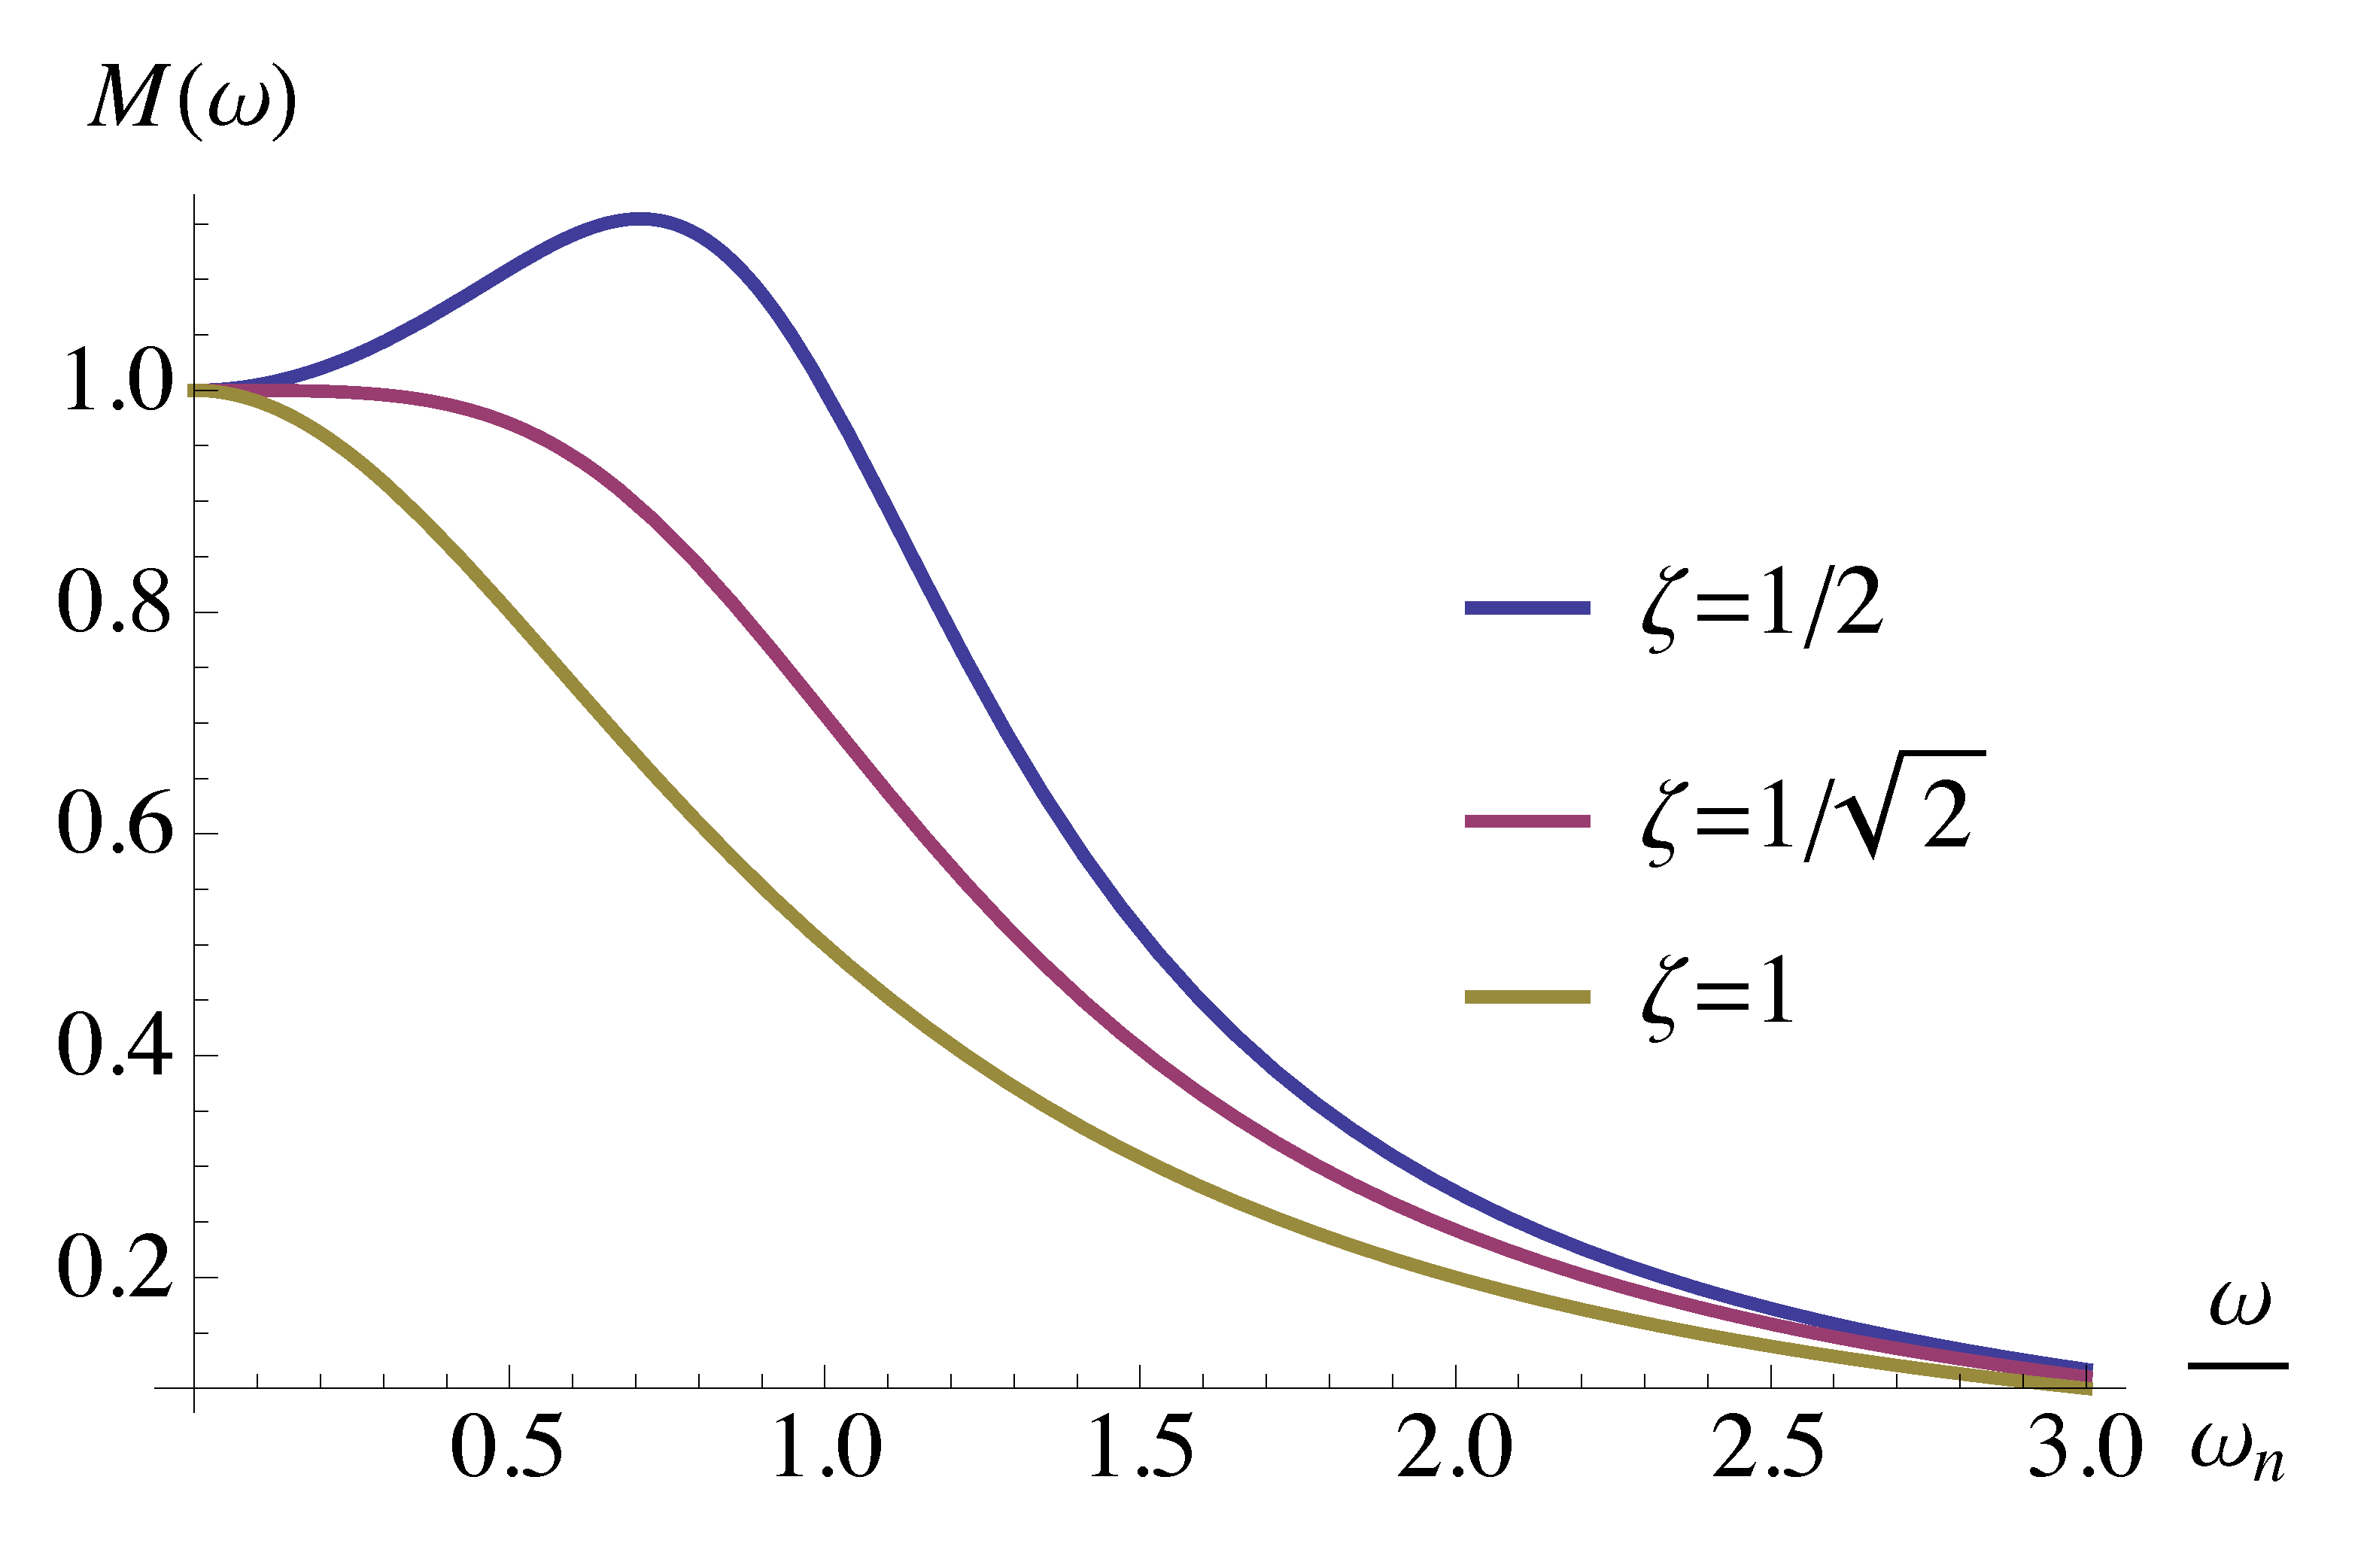
Figure 10: Magnitude \(M(\omega)\) as a function of \(\frac{\omega}{\omega_n}\)
The magnitude hits its peak value (for \(\zeta < 1/\sqrt{2} \approx 0.707\)) occurs when frequency hits resonant frequency \(\omega = \omega_r\), where
\[ \omega_r = \omega_n \sqrt{1-2\zeta^2} < \omega_n. \]
As for its magnitude plot of Bode, we notice for small \(\zeta < \frac{1}{\sqrt{2}}\), the magnitude of
\[ \frac{1}{\left(\frac{j\omega}{\omega_n}\right)^2 + 2\zeta \frac{j\omega}{\omega_n} + 1} \]
has a resonant peak at the resonant frequency
\[ \omega_r = \omega_n \sqrt{1-2\zeta^2}. \]
Likewise, the magnitude of
\[ \left(\frac{j\omega}{\omega_n}\right)^2 + 2\zeta \frac{j\omega}{\omega_n} + 1 \]
has a resonant dip at \(\omega_r\).
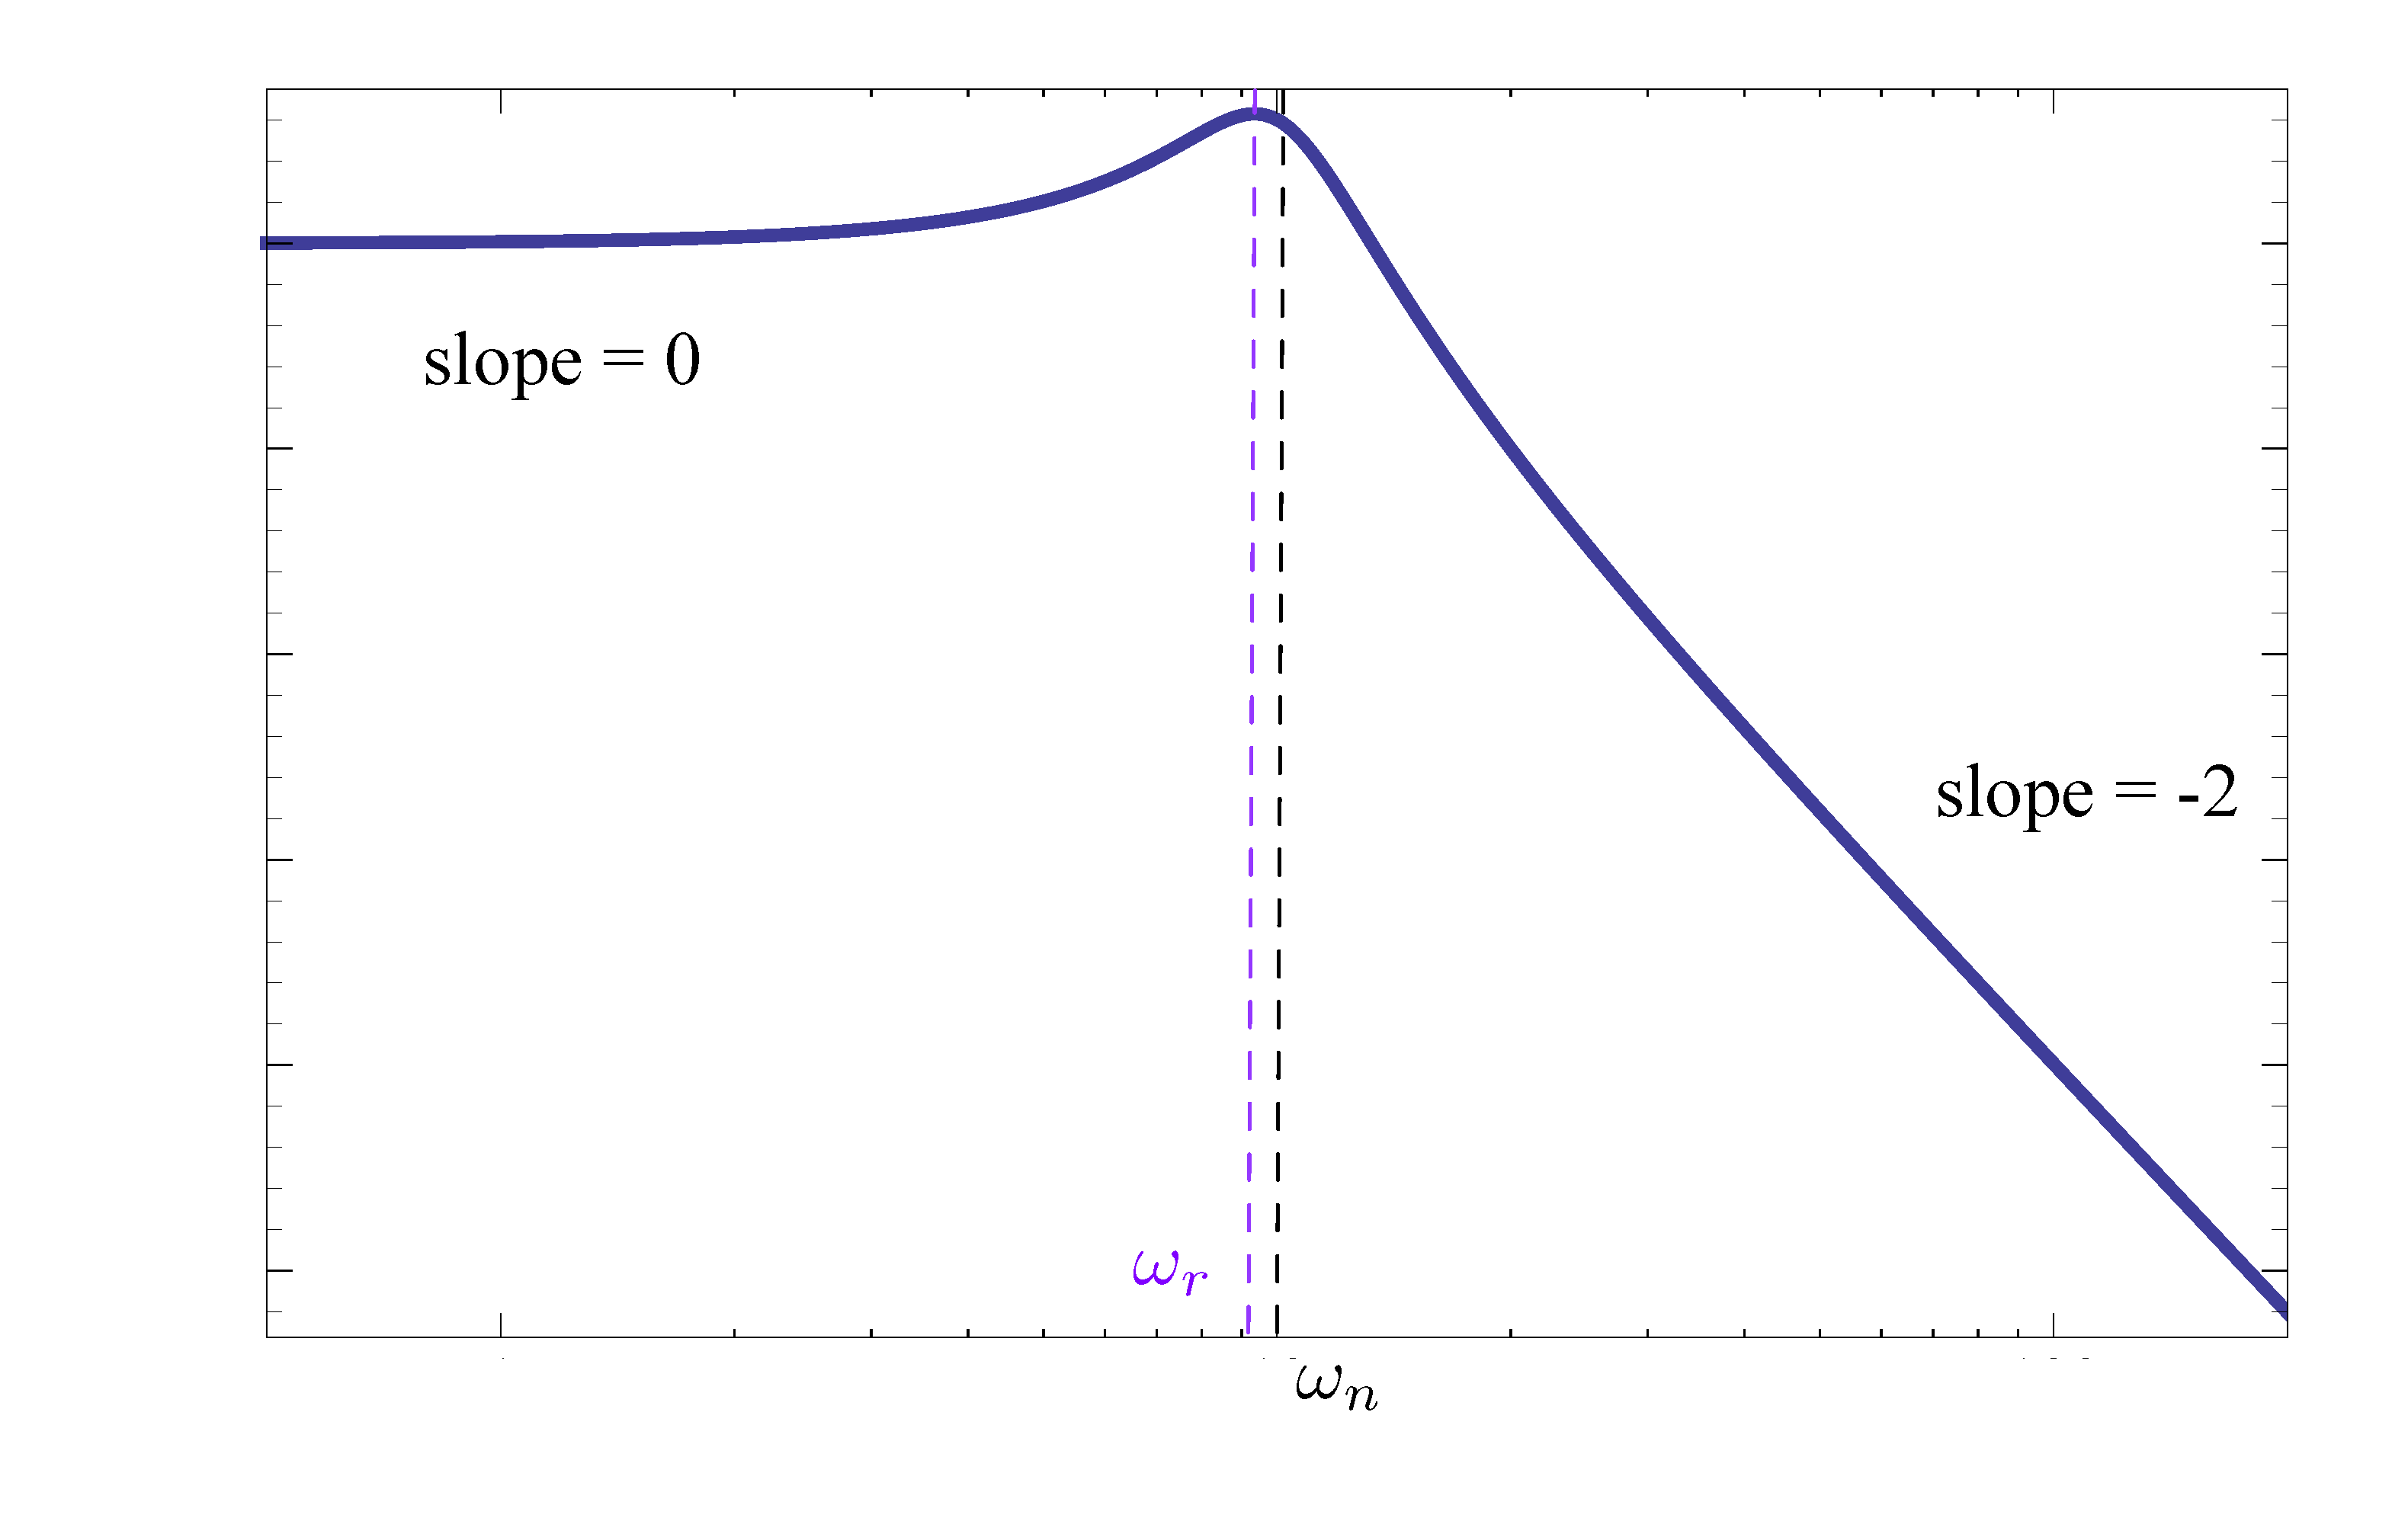
Figure 11: Magnitude plot of factor of Type 3 (stable poles)
Therefore, for factor of Type 3 of a stable complex pole, the magnitude slope “steps down” by \(2\) at the breakpoint.
As for the phase plots of Bode for both Type 3 factors \(\left[ \left(\frac{j\omega}{\omega_n}\right)^2 + 2\zeta \frac{j\omega}{\omega_n} + 1\right]^{\pm 1}\), using Equation \eqref{d14_eq1} and Figure 8 above
- for \(\omega \ll \omega_n\), \(\phi \approx 0^\circ\) (close to positive \(1\) on the real axis);
- for \(\omega = \omega_n\), \(\phi = 90^\circ\) (\({\rm Re} = 0,\, {\rm Im} > 0\));
- for \(\omega \gg \omega_n\), \(\phi \approx 180^\circ\). (Why? Hint: \({\rm Re} \sim -\omega^2\), \({\rm Im} \sim \omega\), take tangent value of this angle, it is almost \(0\).)
Therefore, for factor of Type 3 of a stable complex zero, the phase “steps up” by \(180^\circ\) as we go through the breakpoint; as \(\zeta \to 0\), the transition through the breakpoint gets sharper, almost step-like.
In the case of a factor of Type 3 of a stable complex pole, the phase is multiplied by \(-1\), hence the phase “steps down” by \(180^\circ\) as we go through the breakpoint.
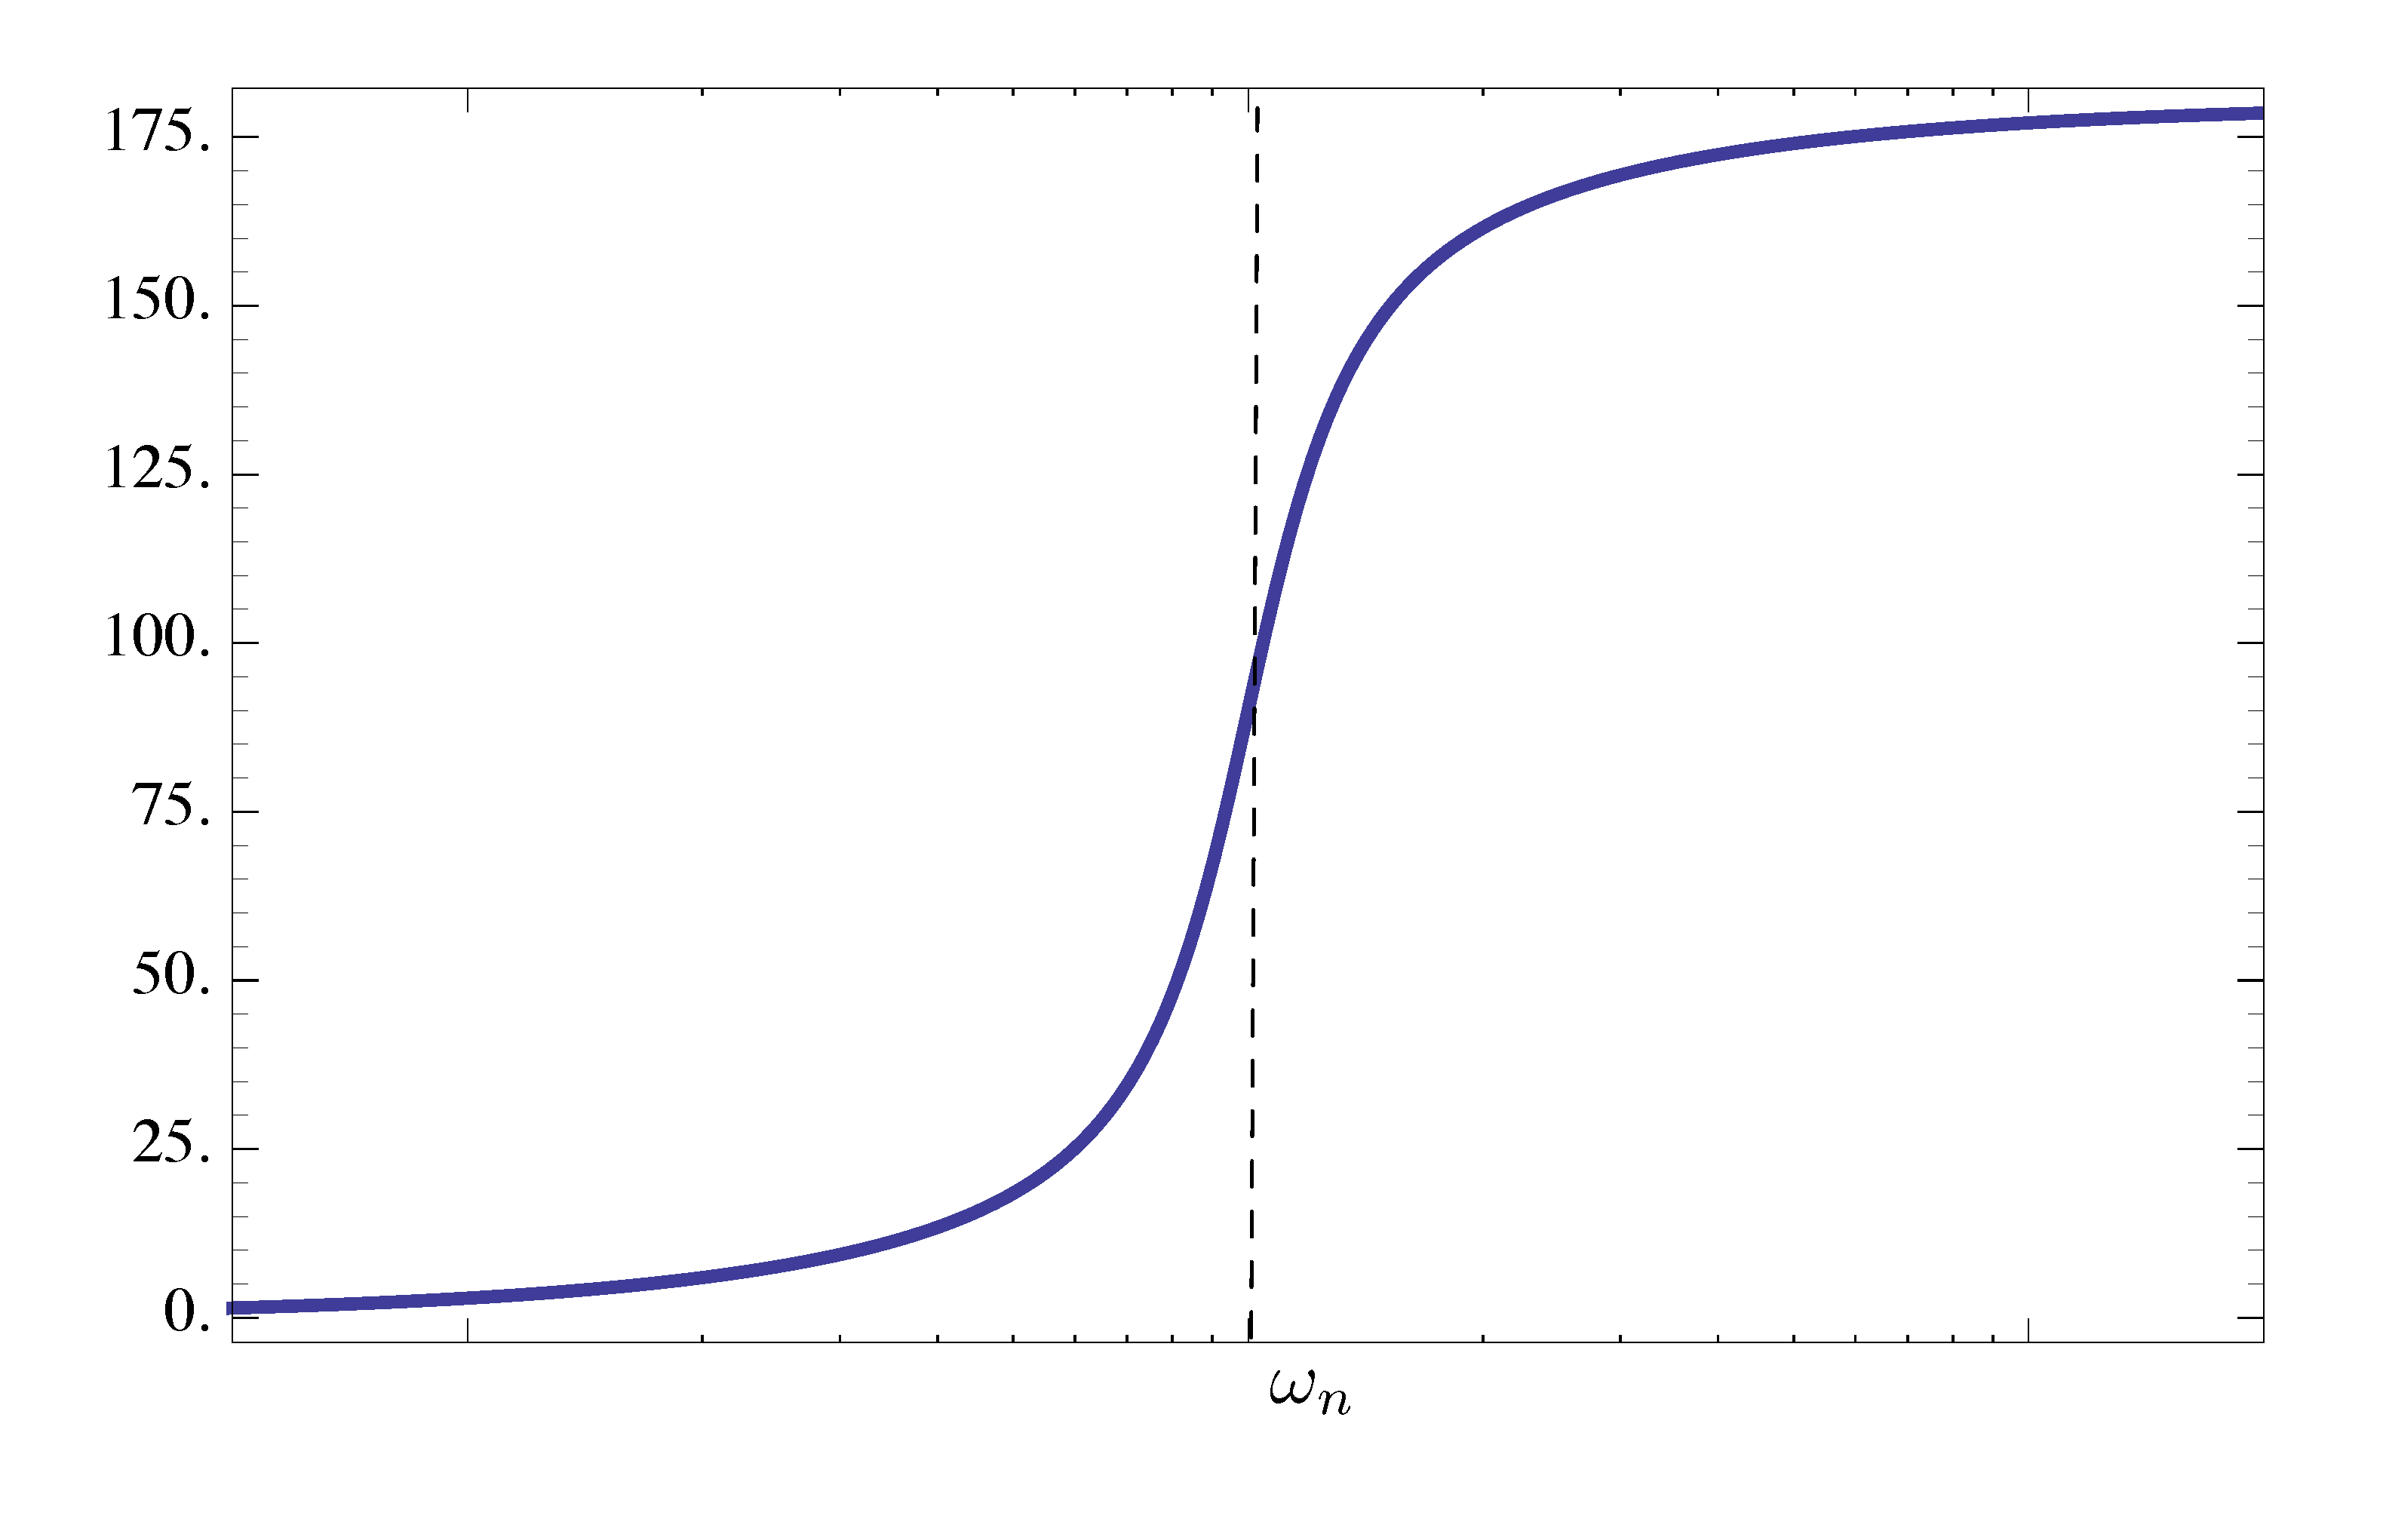
Figure 12: Phase plot of factor of Type 3 (stable zeros), phase “steps up” by \(180^\circ\) at breakpoint
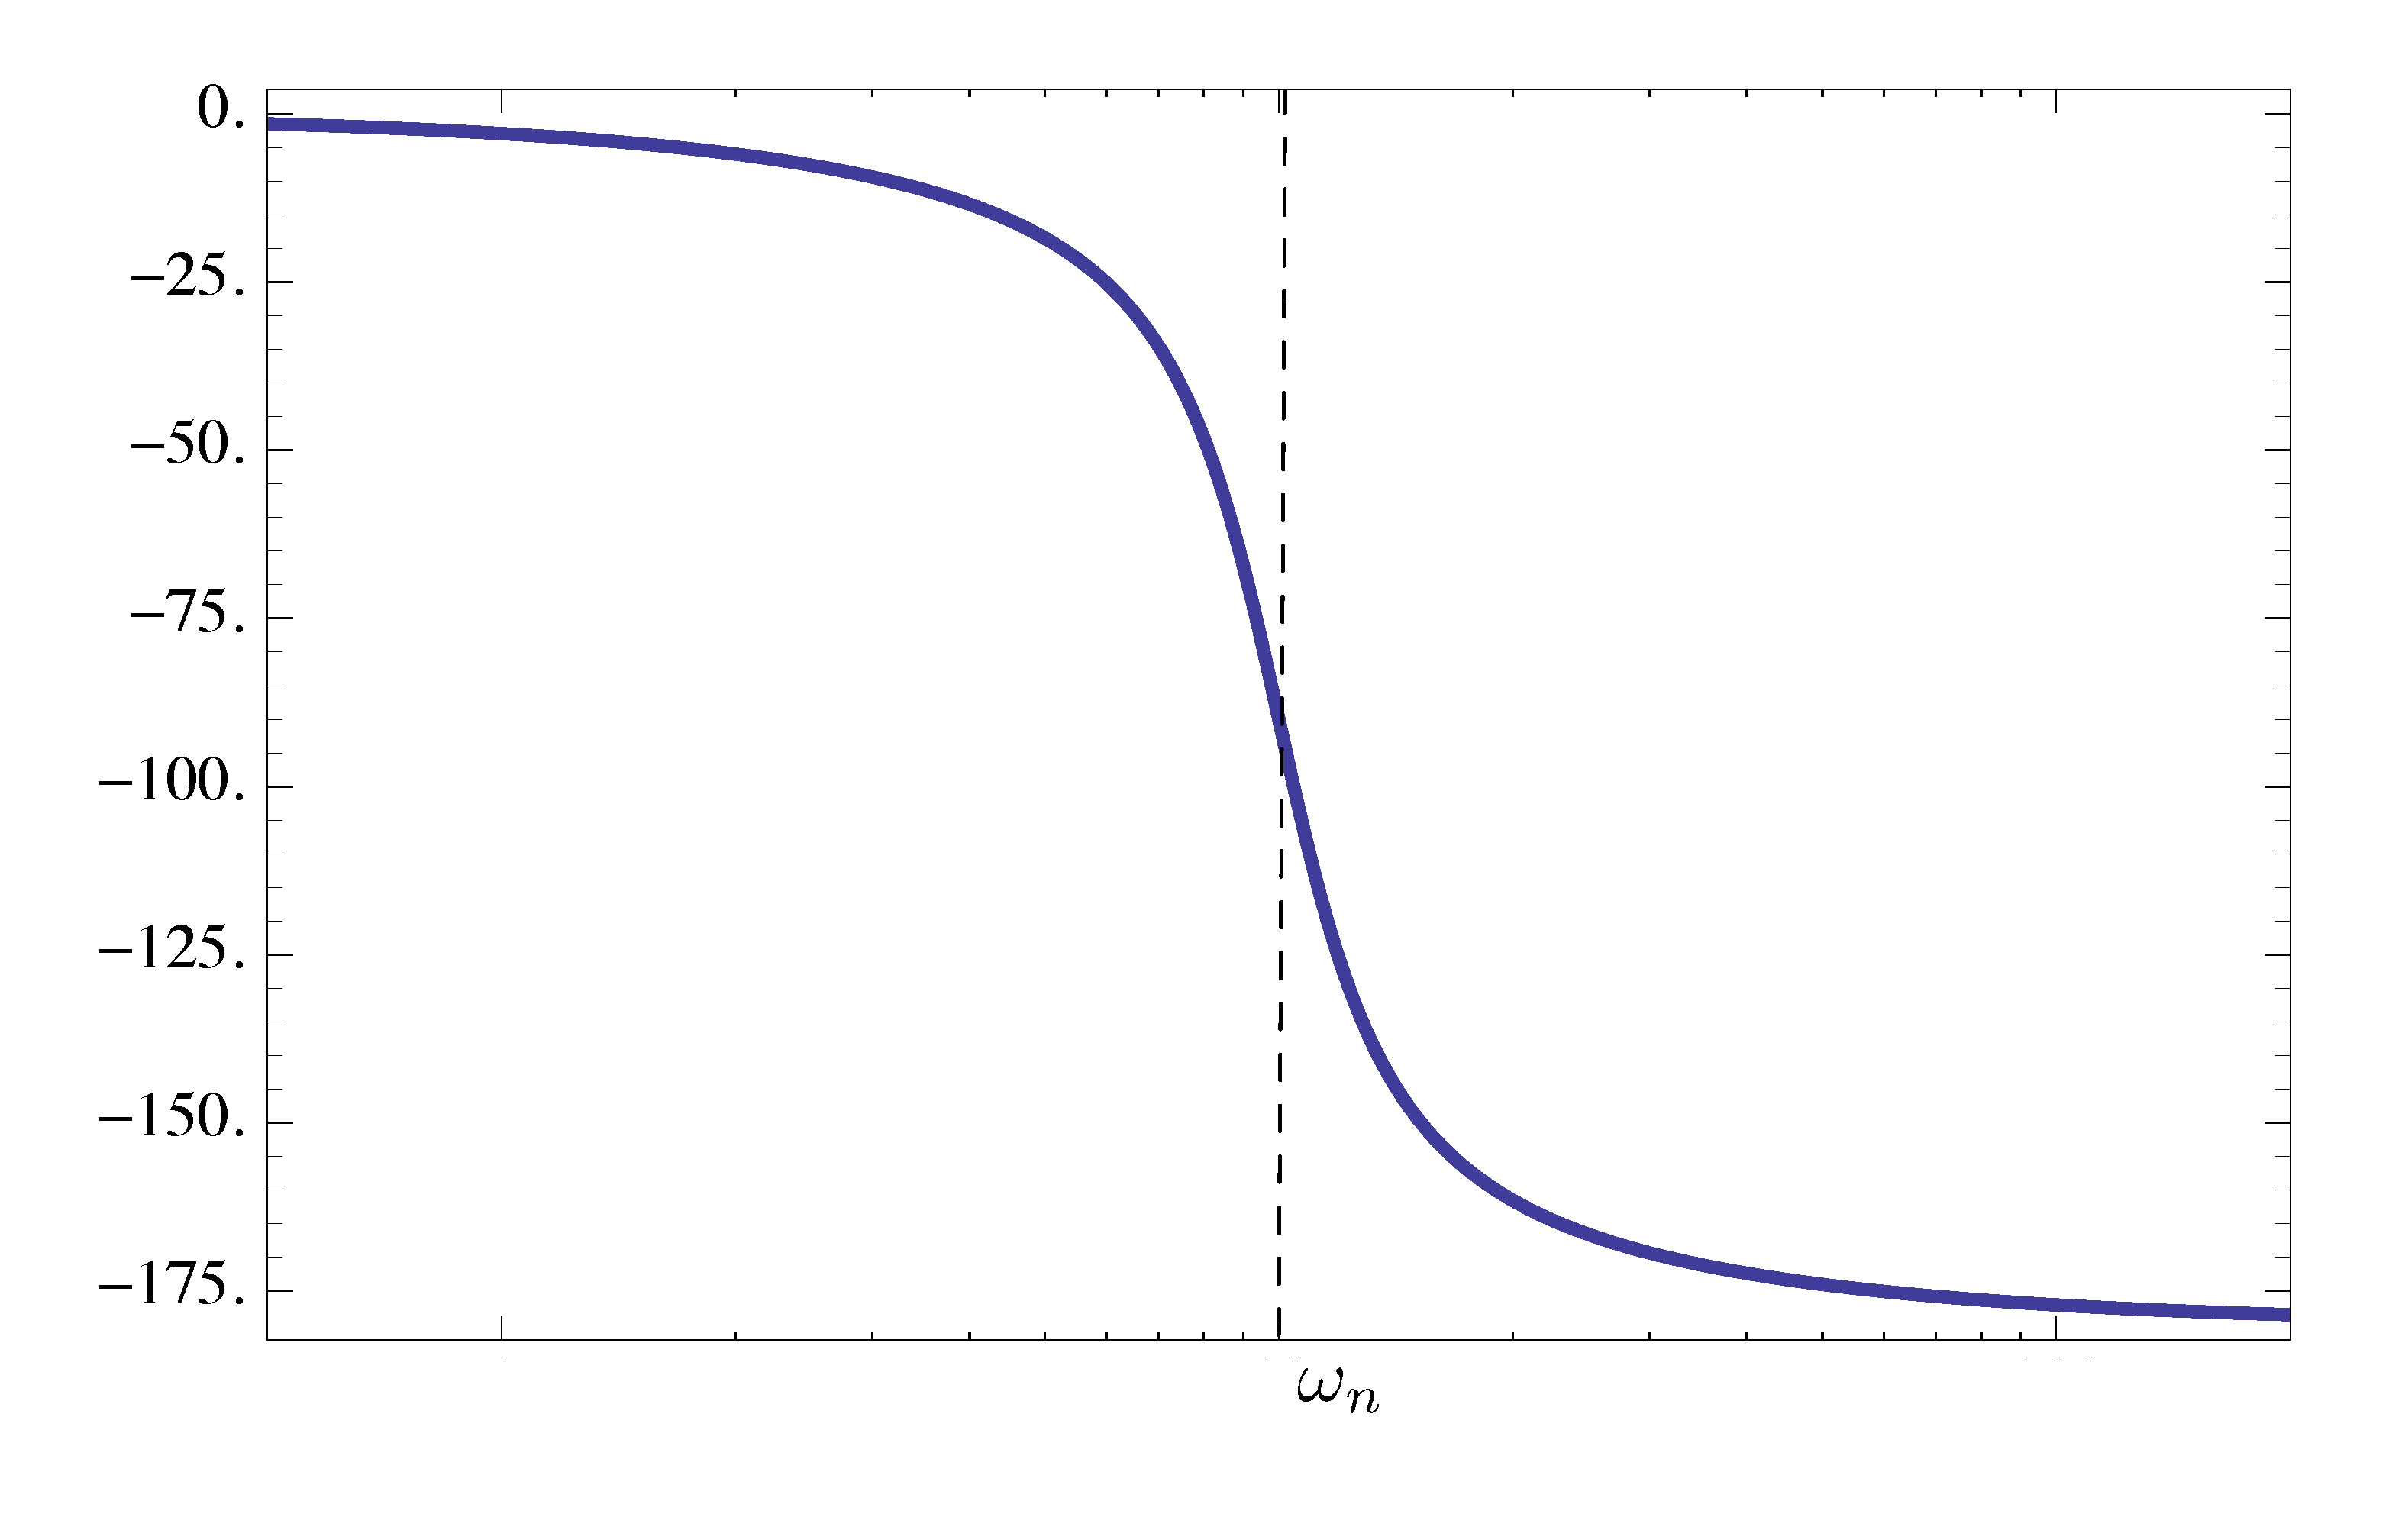
Figure 13: Phase plot of factor of Type 3 (stable poles), phase “steps down” by \(180^\circ\) at breakpoint
Example 2: Sketch the Bode plot of the following given transfer function \(KG(s)\)
\begin{align*} KG(s) = \frac{0.01 \left(s^2 + 0.01s + 1\right)}{s^2 \left(\dfrac{s^2}{4} + 0.02 \dfrac{s}{2} + 1 \right)}. \end{align*}Solution: The given open loop transfer function is in Bode form already. As for its magnitude plot, we have
- Type 1 factor \(\dfrac{0.01}{(j\omega)^2}\) has \(K_0 = 0.01\), \(n=-2\). Its low-frequency asymptote has slope \(=-2\), passing through \((\omega, M) = (1, 0.01)\).
- Type 3 factor of complex zeros has breakpoint at \(\omega_n = 1\) and \(\zeta = 0.005\). It makes slope step up by \(2\) at that breakpoint and there will be a large resonant dip.
- Type 3 factor of complex poles has breakpoint at \(\omega_n = 2\) and \(\zeta = 0.01\). It makes slope step down by \(2\) at that breakpoint and there will be a large resonant peak.
The magnitude plot is shows in Figure 14.
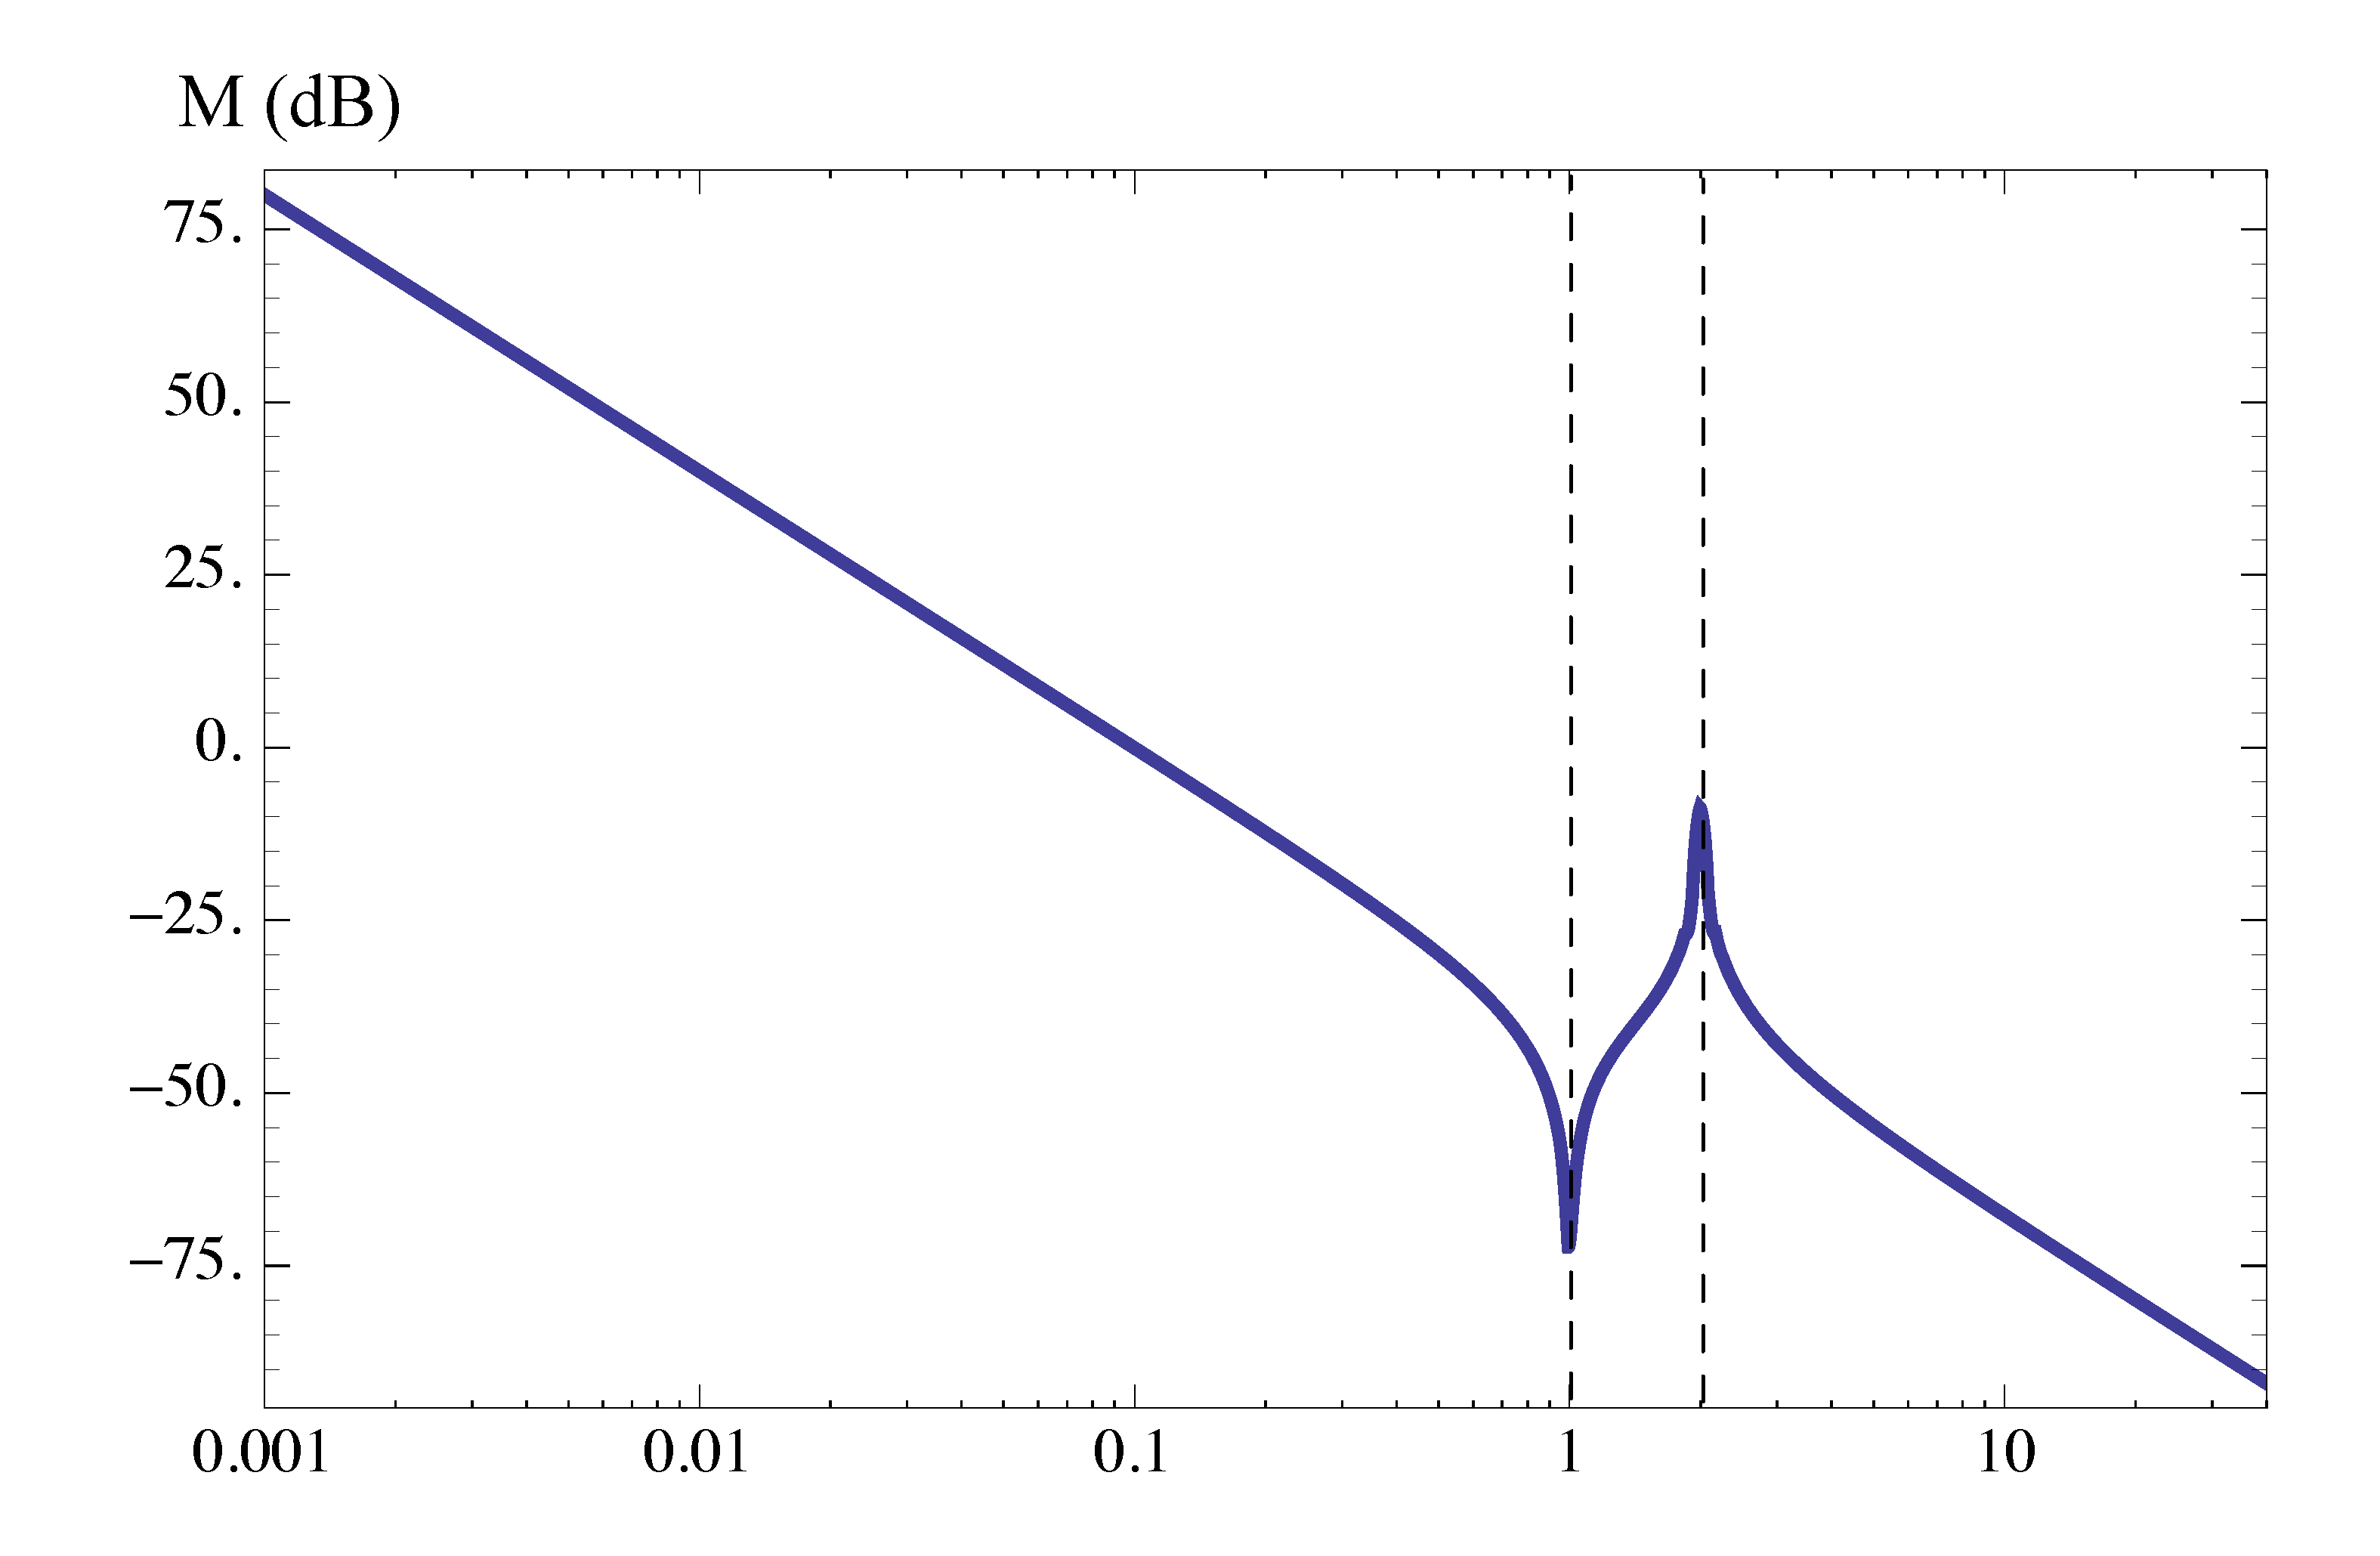
Figure 14: Magnitude plot of Example 2
As for its phase plot,
- Type 1 factor \(\dfrac{0.01}{(j\omega)^2}\) has \(K_0 = 0.01\), \(n=-2\). So phase starts at \(n \times 90^\circ = -180^\circ\).
- Type 3 factor of complex zeros has breakpoint at \(\omega_n = 1\). It makes phase step up by \(180^\circ\) at that breakpoint.
- Type 3 factor of complex poles has breakpoint at \(\omega_n = 2\). It makes phase step down by \(180^\circ\) at that breakpoint.
- \(\zeta\) is small for both Type 3 factors of complex poles and zeros, so the transitions are very sharp.
The phase plot is shows in Figure 15.

Figure 15: Phase plot of Example 2
Factors with RHP Zeros
So far, we’ve only looked at transfer functions with Left Half Plane poles and zeros except perhaps at the origin for Type 1. What about factors with RHP poles and zeros?
Consider two transfer functions below,
\begin{align*} G_1(s) = \frac{s+1}{s+5}, \, G_2(s) = \frac{s-1}{s+5}. \end{align*}We notice
- \(G_1\) has a stable pole and zero; \(G_2\) has a stable pole but a RHP zero.
Nevertheless, the magnitude plots of \(G_1\) and \(G_2\) are the same since
\begin{align*} |G_1(j\omega)| &= \left| \frac{j\omega+1}{j\omega+5}\right| = \sqrt{\frac{\omega^2+1}{\omega^2+5}}, \\ |G_2(j\omega)| &= \left| \frac{j\omega-1}{j\omega+5}\right| = \sqrt{\frac{\omega^2+1}{\omega^2+5}}. \end{align*}- All the difference is in the phase plots.
Indeed, to sketch the phase plot for \(G_1\), write it in Bode form
\begin{align*} G_1(j\omega) &= \frac{j\omega+1}{j\omega + 5} \\ &= \frac{1}{5} \frac{j\omega+1}{\dfrac{j\omega}{5}+1}. \end{align*}Then apply the rules we have discussed for factors with stable poles and zeros,
- Type 1 factor \(\dfrac{1}{5}(j\omega)^0\) has \(n=0\), so phase starts at \(0^\circ\).
- Type 2 factor of a stable zero has breakpoint at \(\omega_n=1\); it makes phase go up by \(90^\circ\).
- Type 2 factor of a stable pole has breakpoint at \(\omega_n = 5\); it makes phase go down by \(90^\circ\).
The phase plot of \(G_1(s)\) is therefore
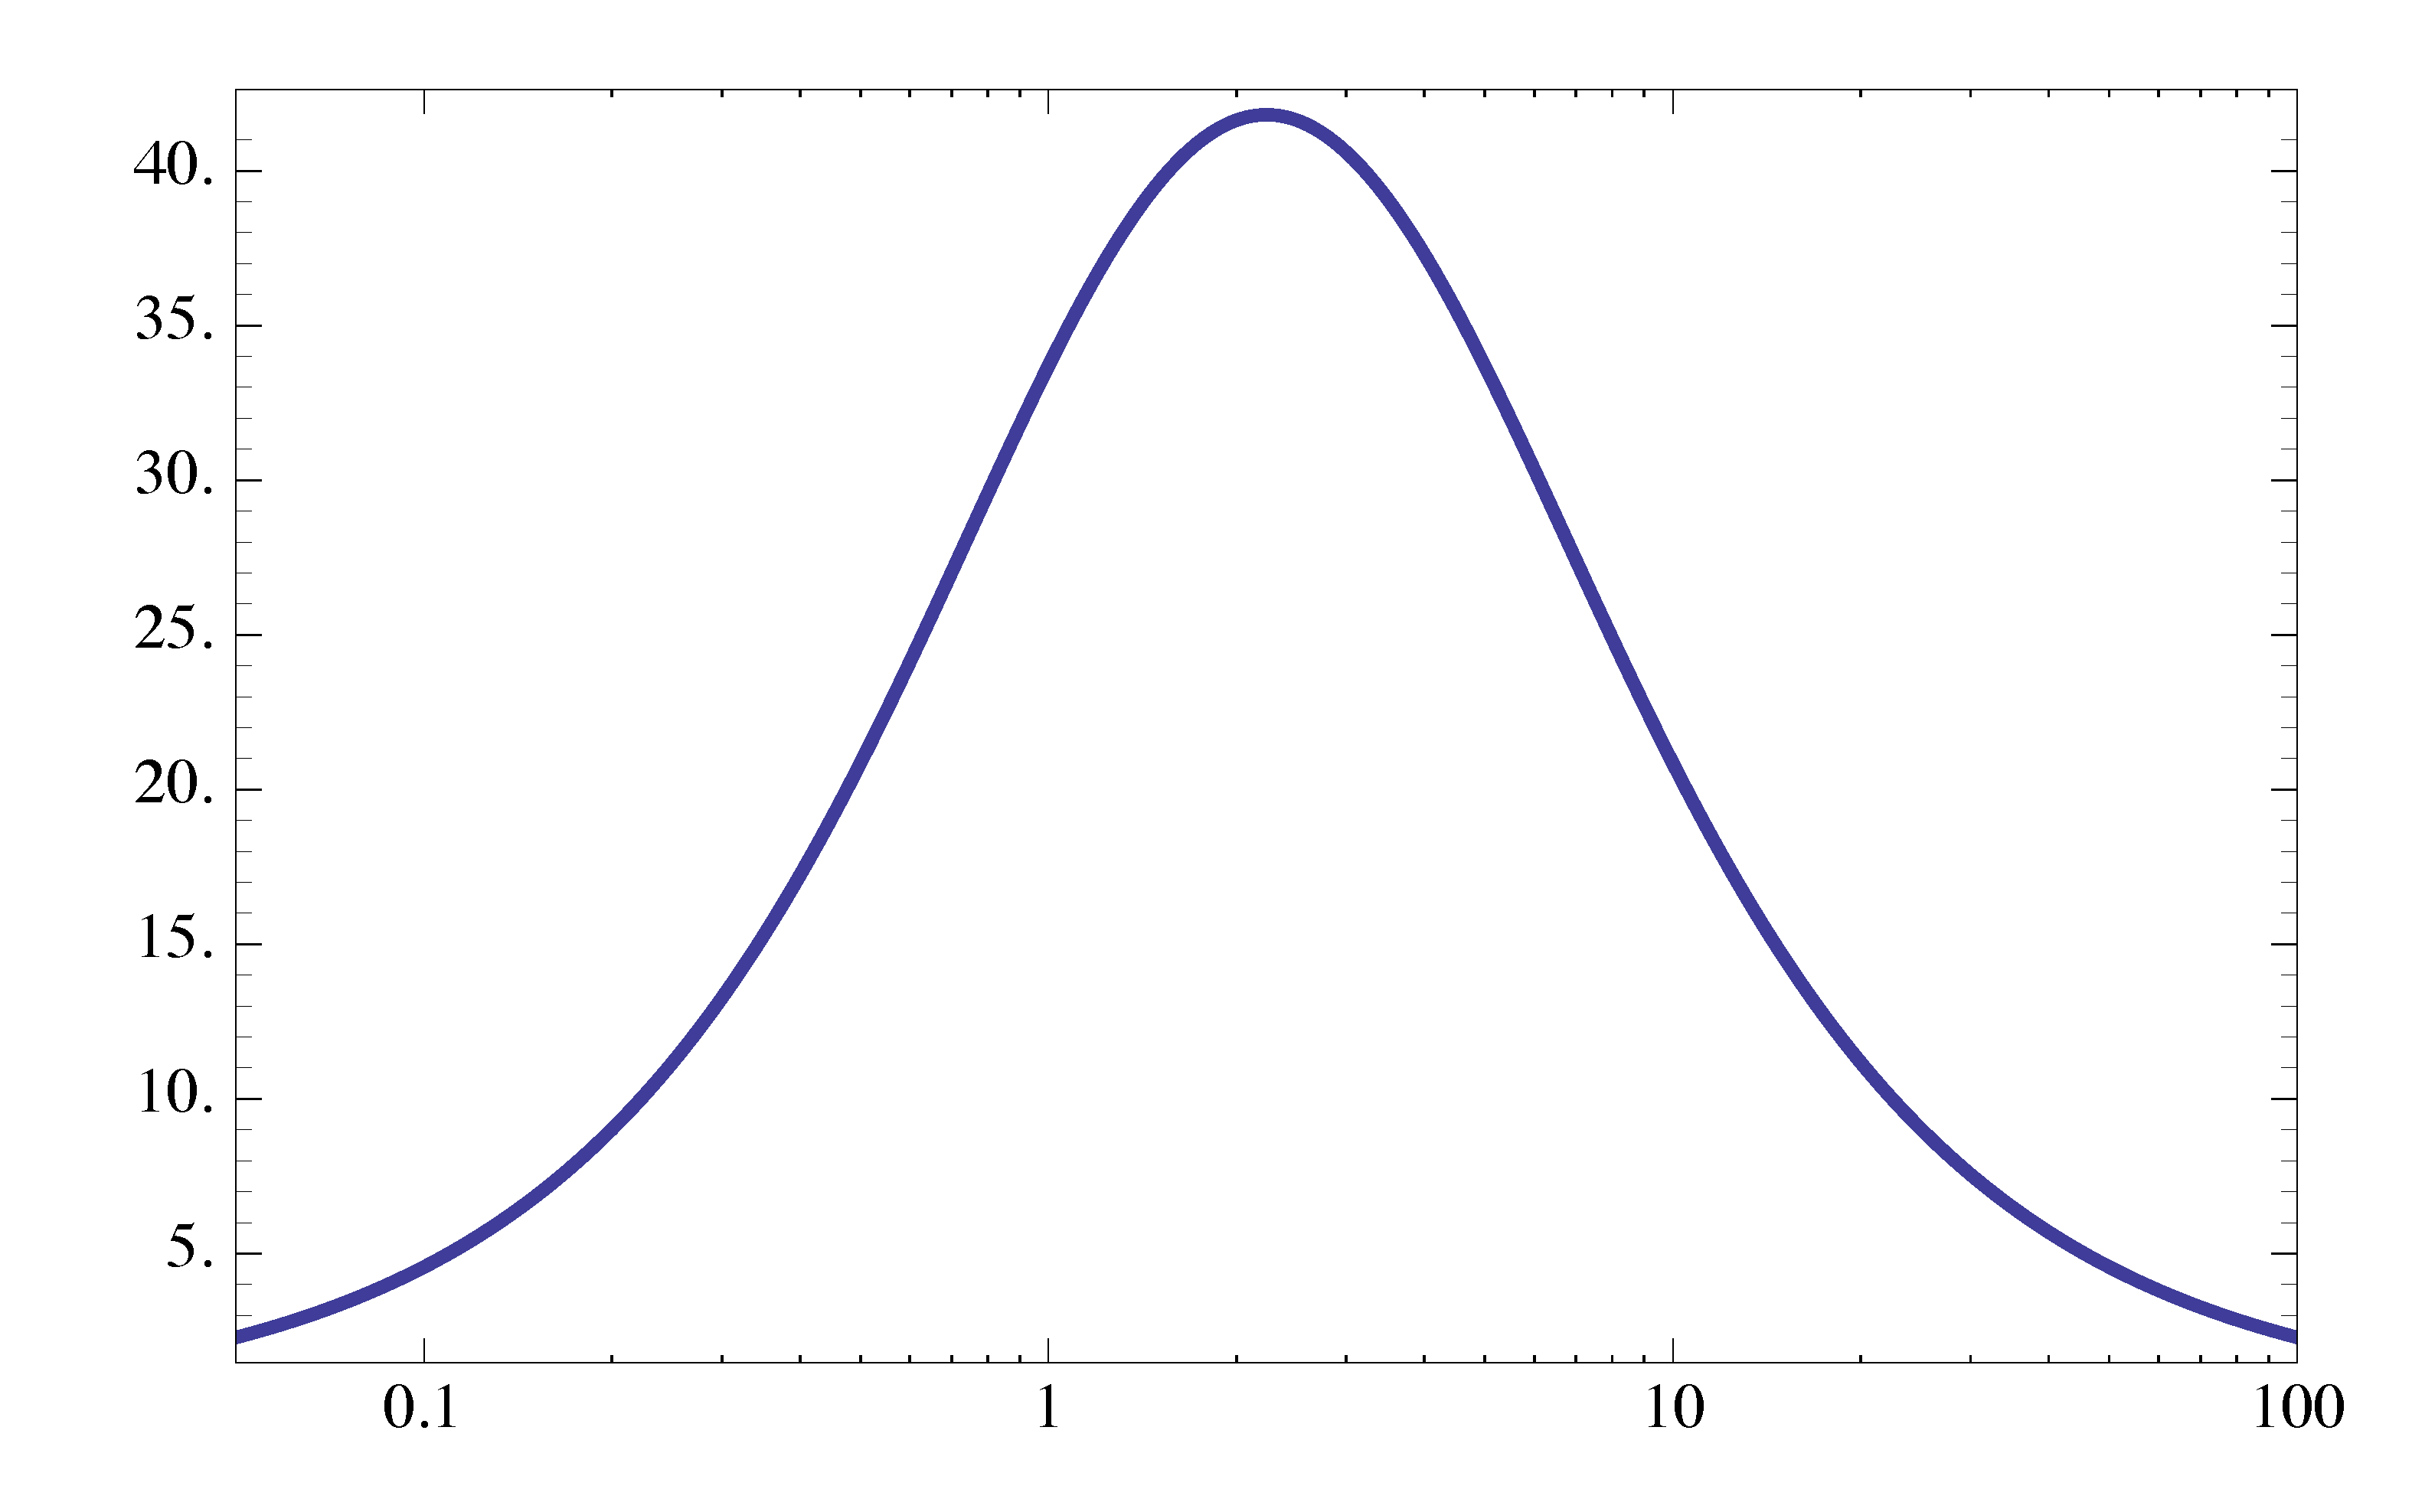
Figure 16: Phase plot of \(G_1(s)\)
We cannot apply the rules about stable poles and zeros to sketching phase plot for \(G_2\). So we need to rework out the study of Nyquist plot of a RHP zero in this case.
\begin{align*} G_2(j\omega) &= \frac{j\omega-1}{j\omega + 5} \\ &= \frac{1}{5} \frac{j\omega-1}{\dfrac{j\omega}{5}+1} \end{align*}The Nyquist plot for \(j\omega-1\) is shown in Figure 17.
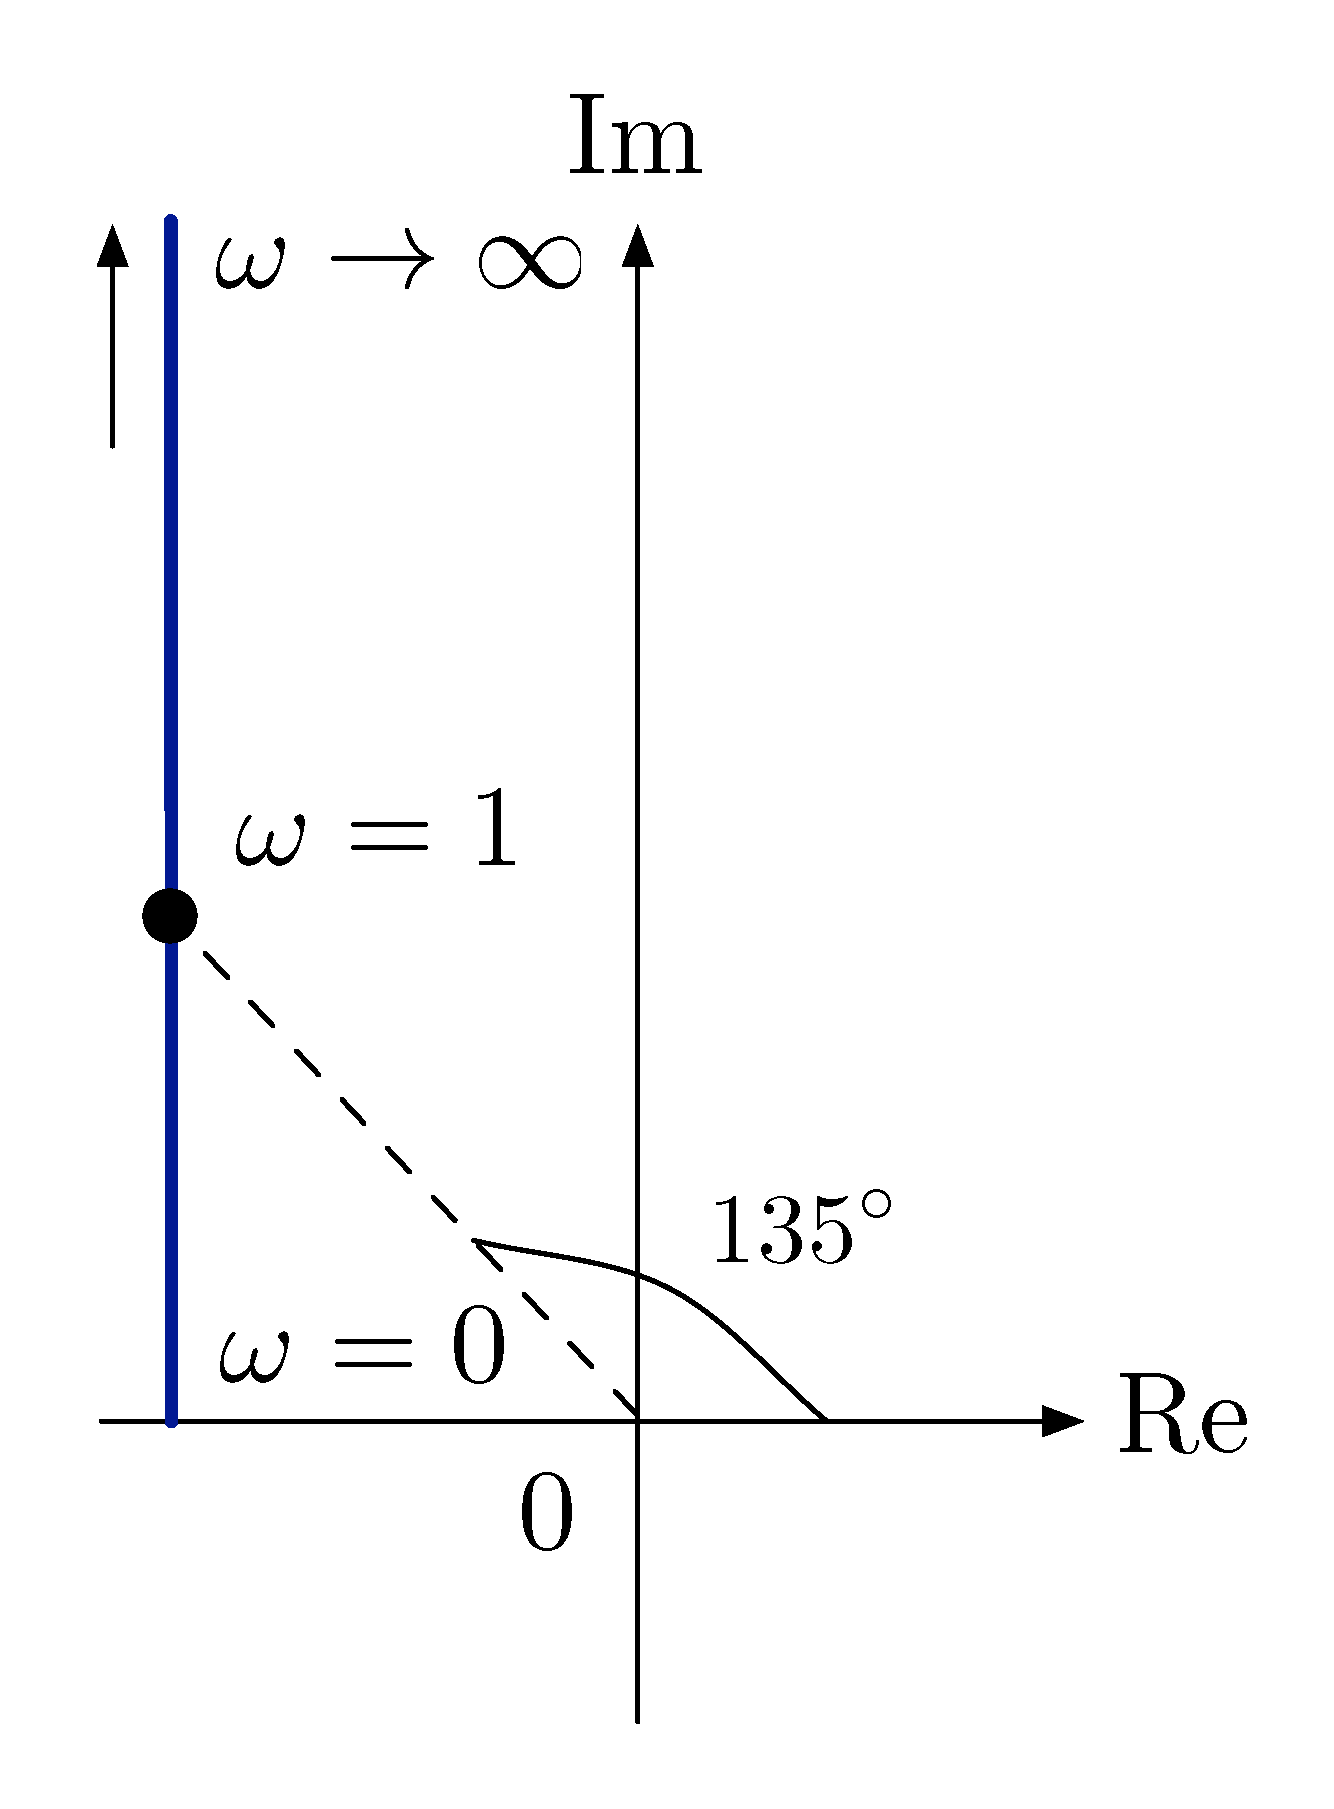
Figure 17: Nyquist plot of \(j\omega-1\)
The new type of behavior of RHP zeros is
- when \(\omega \approx 0\), \(\phi \approx 180^\circ\) (close to negative \(1\) on the real axis);
- when \(\omega \gg 1\), \(\phi \approx 90^\circ\) (\({\rm Re} =-1\), \({\rm Im} = \omega \gg 1\));
- when \(\omega \approx 1\), \(\phi \approx 135^\circ\).
Therefore for a RHP zero, the phase starts out at \(180^\circ\) and goes down by \(90^\circ\) through the breakpoint. (Phase is \(135^\circ\) at breakpoint.)
For a RHP zero, the phase plot is similar to what we had for a LHP pole — phase goes down by \(90^\circ\). However, it starts at \(180^\circ\), not at \(0^\circ\).
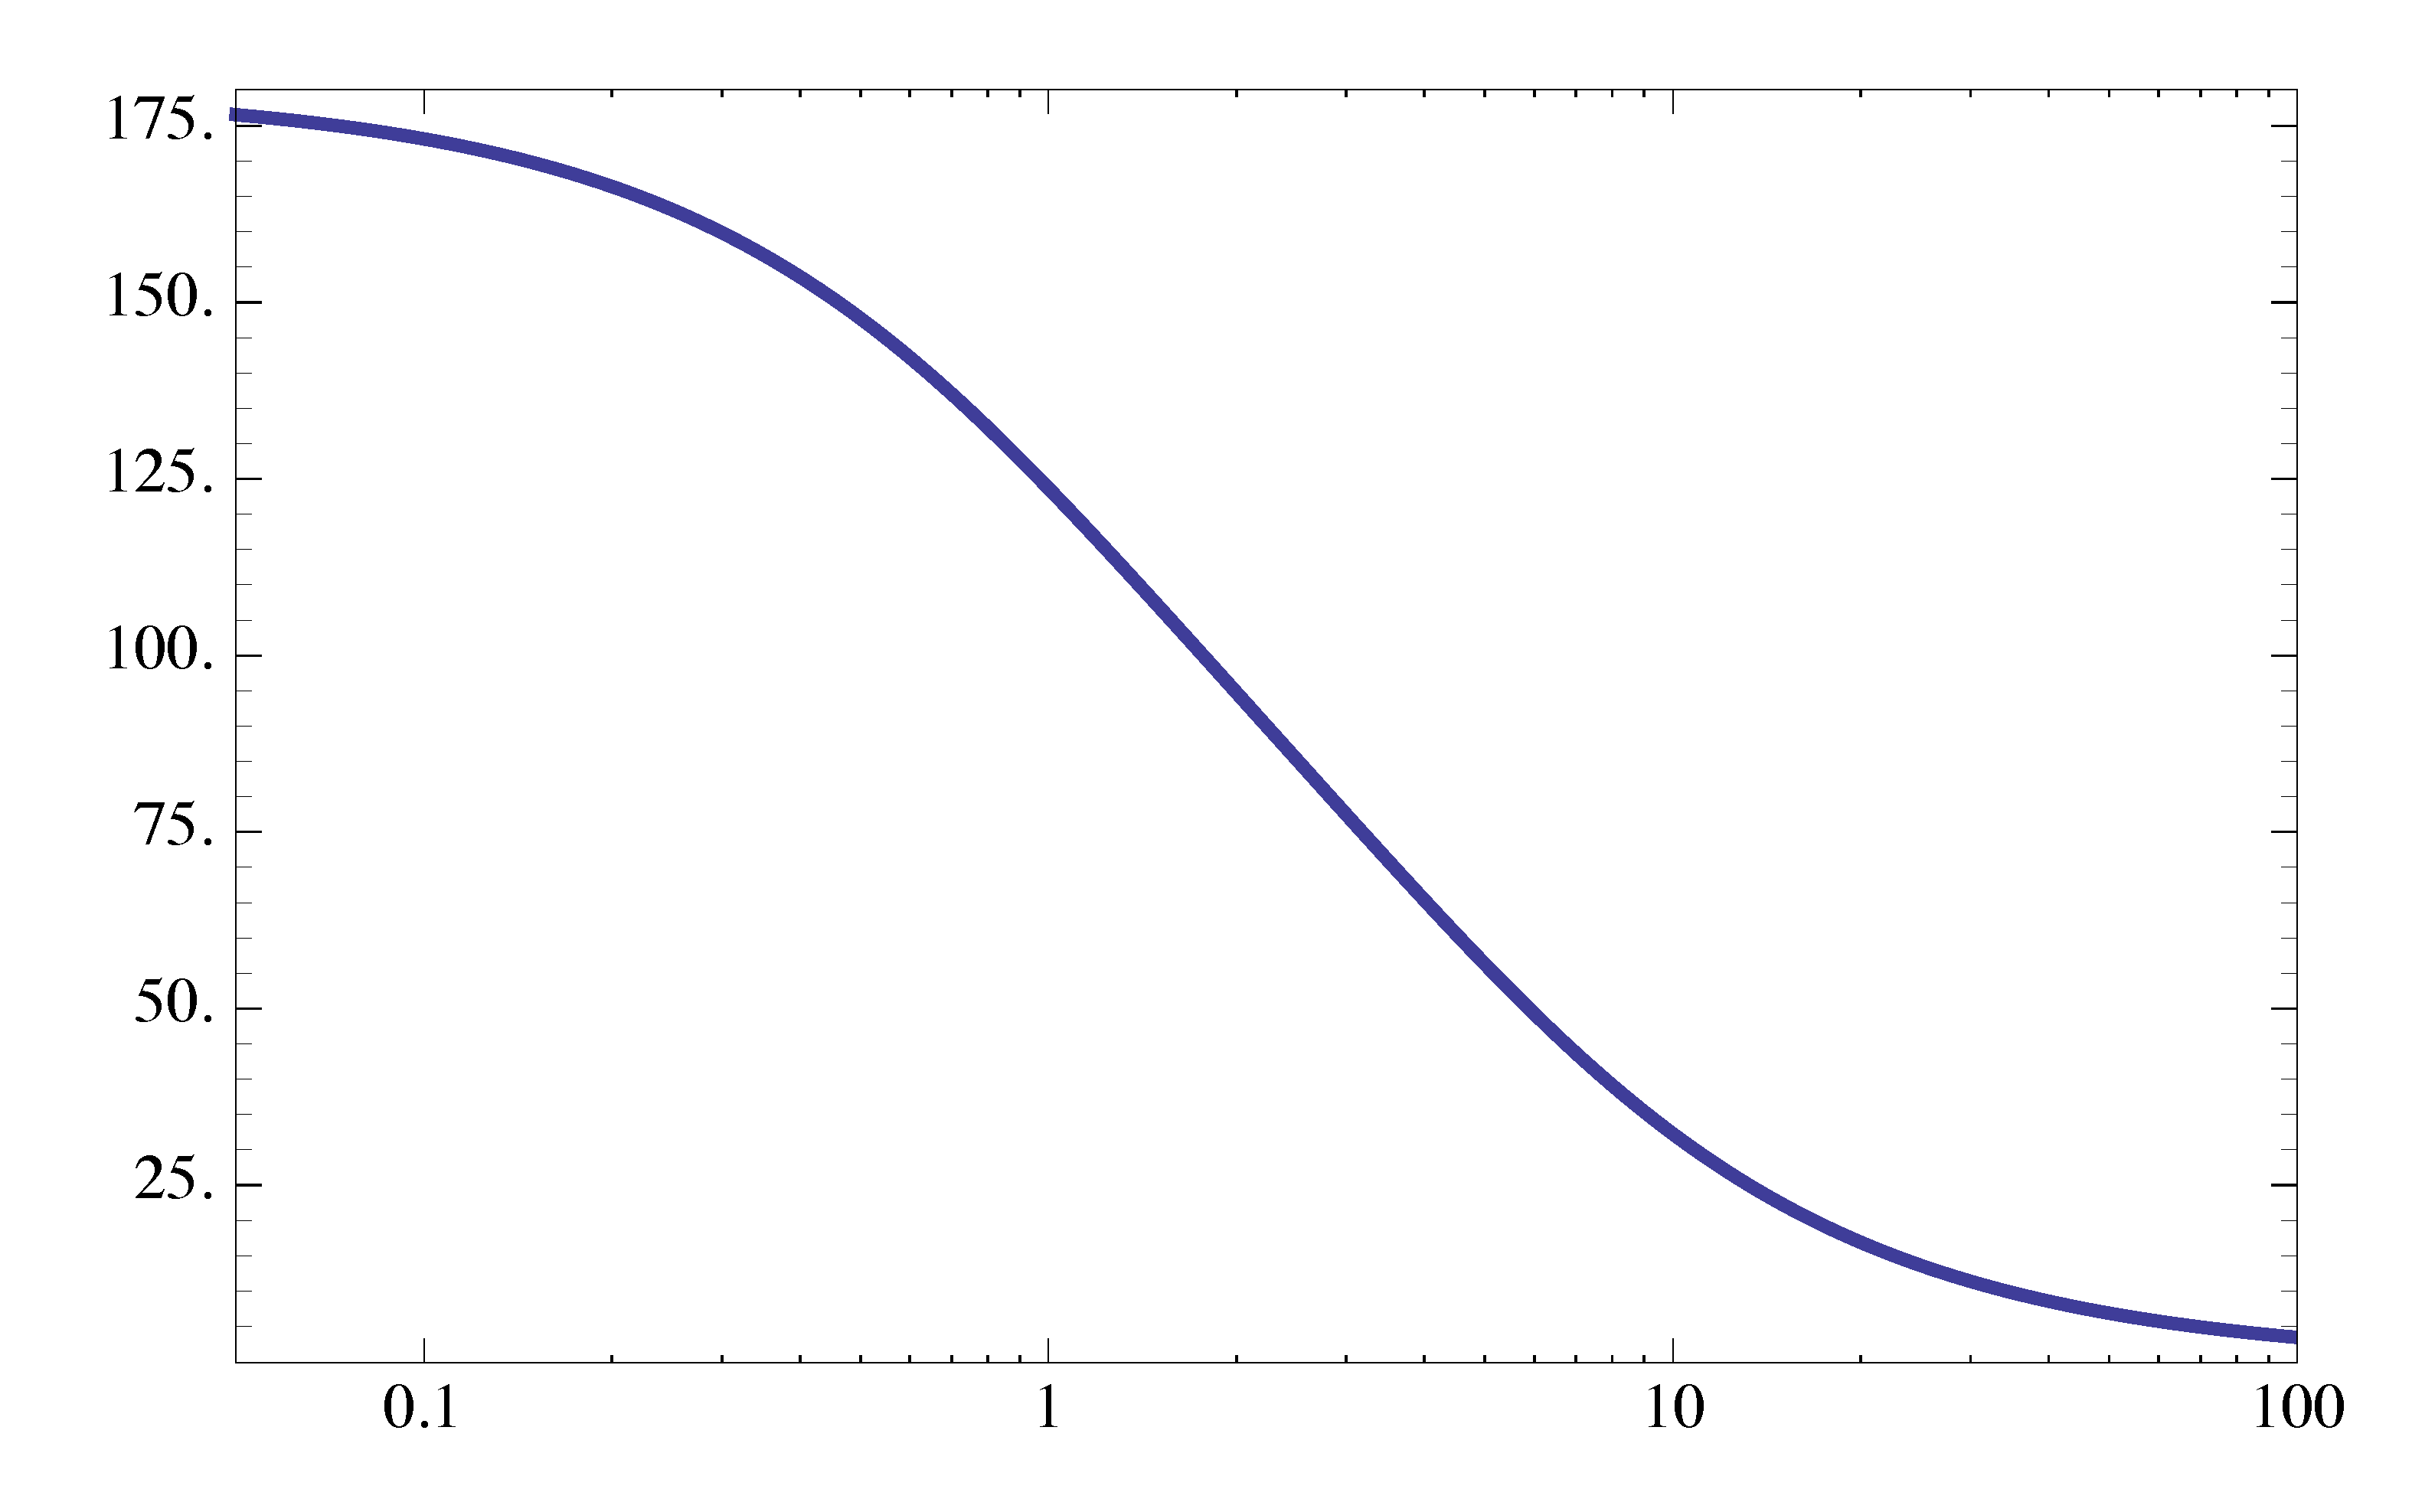
Figure 18: Phase plot of \(G_2(s)\)
Figure 18 shows the phase plot of \(G_2(s)\).
Minimum-Phase and Nonminimum-Phase Zeros
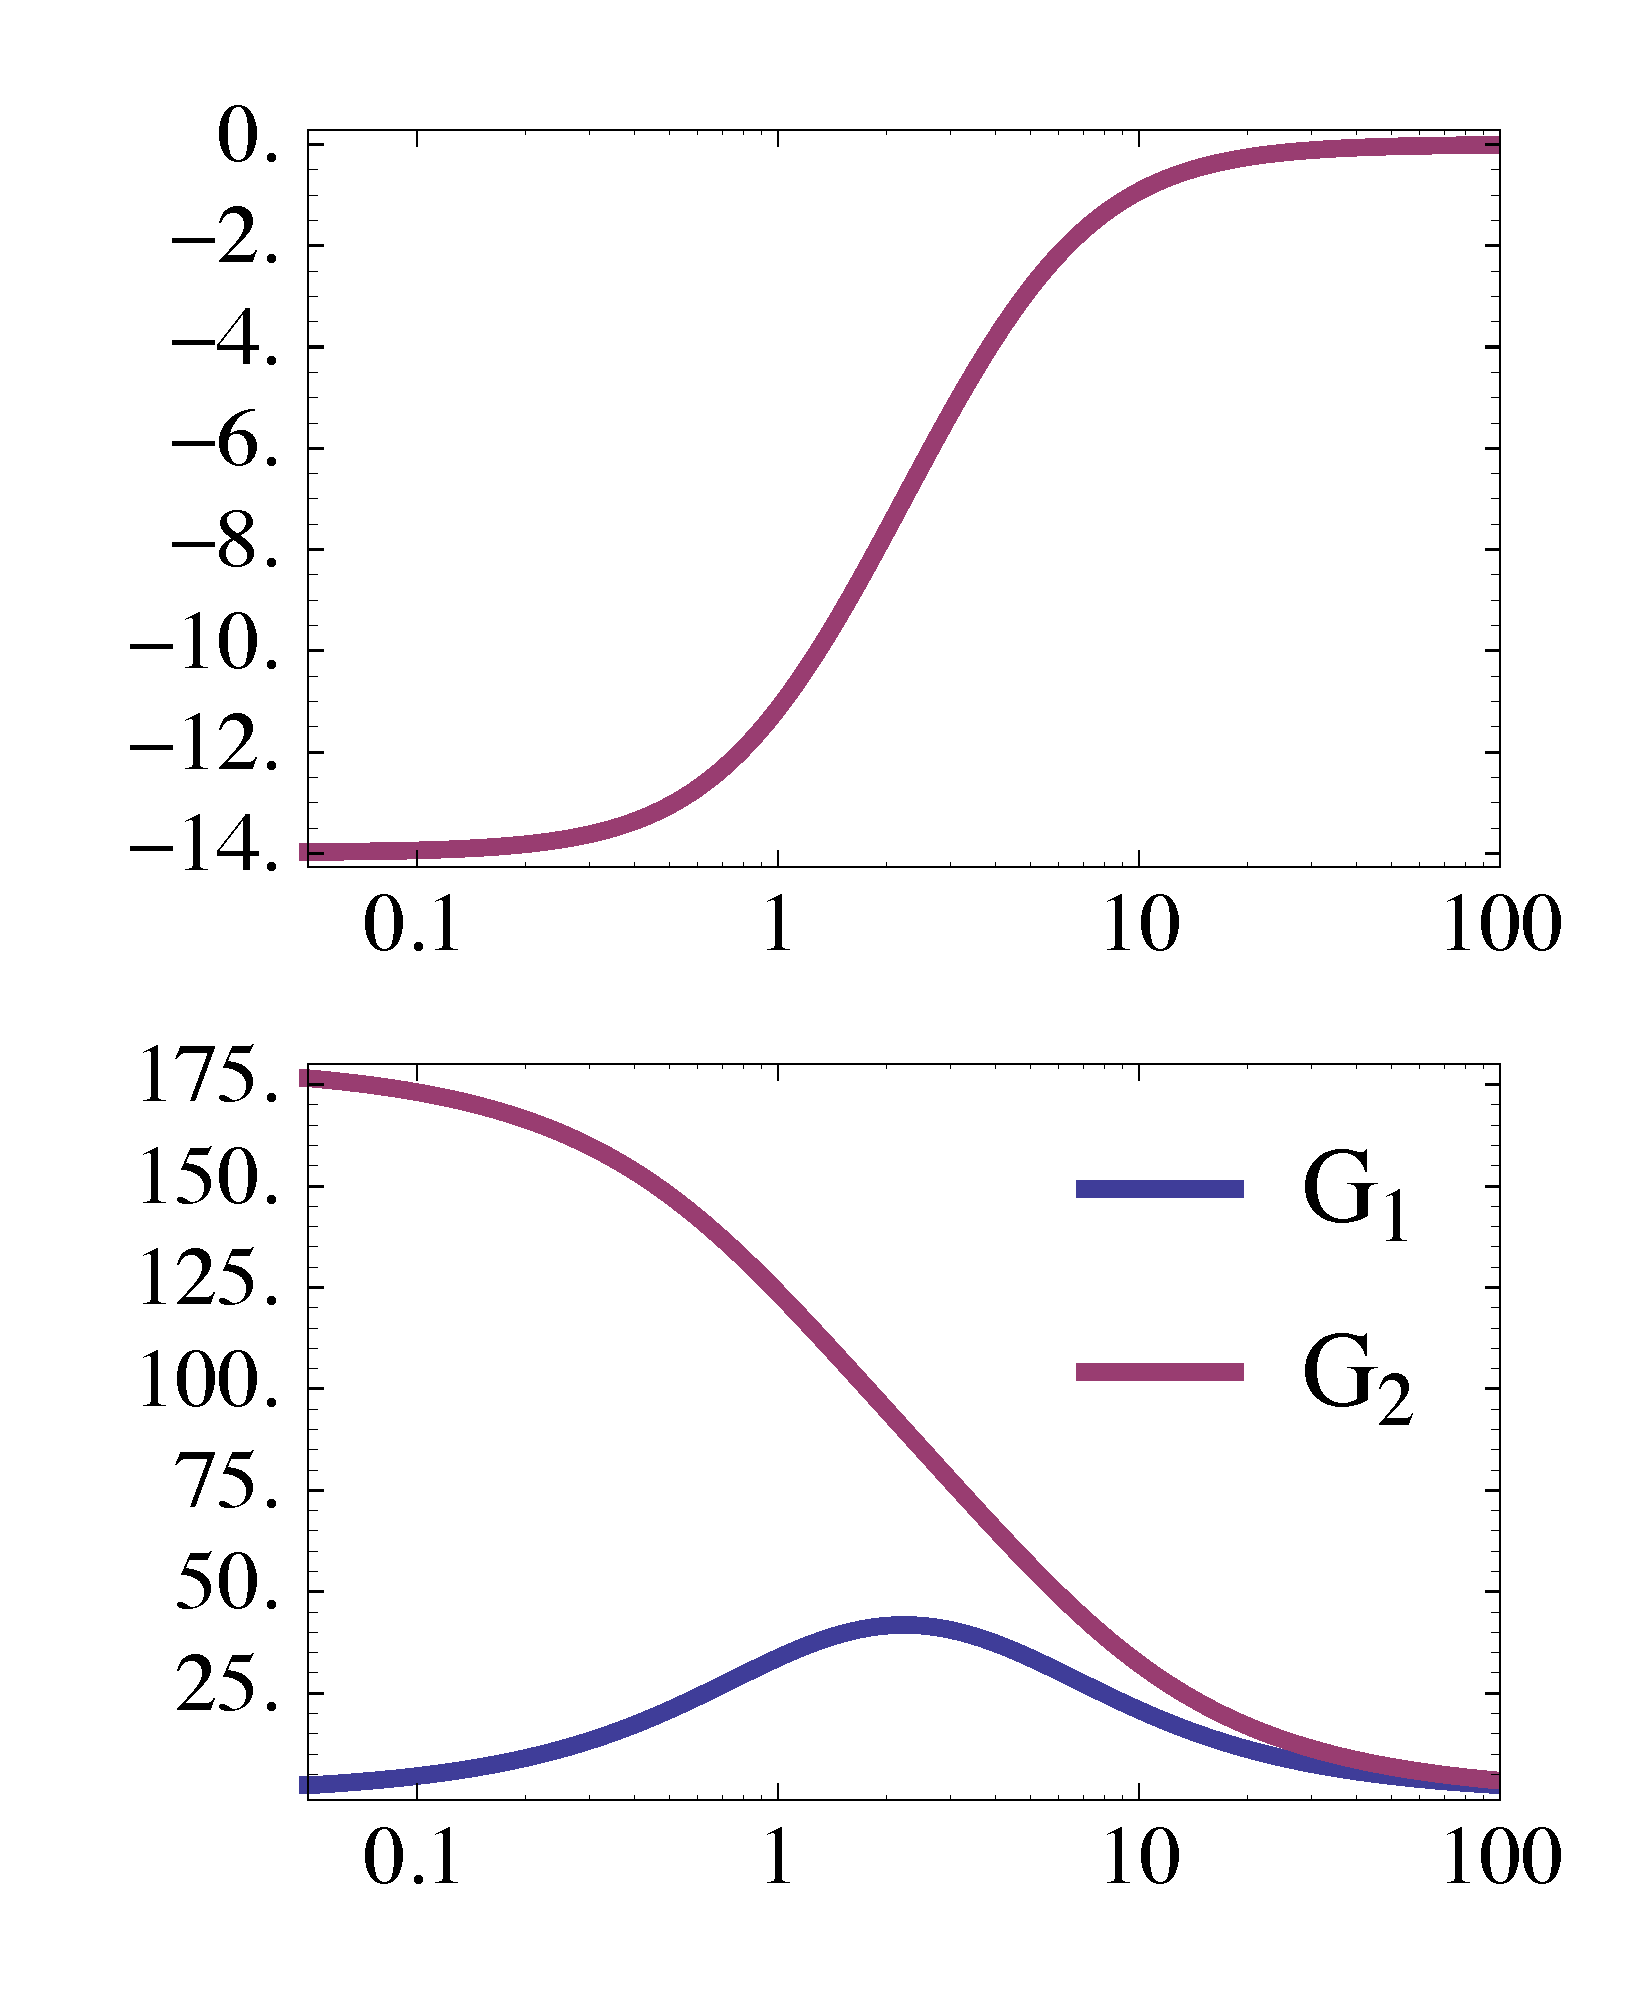
Figure 19: Minimum-Phase and nonminimum-phase zeros
Based off of the discussion from the previous section, among all transfer functions with the same magnitude plot, the one with only LHP zeros has the minimal net phase change as \(\omega\) goes from \(0\) to \(\infty\), hence the term minimum-phase for LHP zeros.