Mini Project 3
Posted: 2021-04-05 | Due: 2021-05-03
Mini Project 3: Application of Data Analysis & Factor Graphs in HPC Security
Introduction
The goal of this project is to understand the progression of an attack that aims to leak secret keys from target system. For data analysis, we provide monitoring logs of a multi-stage attack based on the Equifax breach (2017) that leaked 150 millions of records. For modeling the attack, you will use critical alert-based and factor graph-based analysis techniques.
As a defender, you are given monitoring logs of security events. The events include suspicious activities and critical alerts. You will perform the following tasks:
- Understand a legitimate user’s behaviors and compare those with attacker’s behaviors
- Create a baseline attack detector based on critical alerts
- Build a simple factor graph for modeling a single event and a single attack stage
- Extend the simple factor graph for modeling multiple events, thus capturing the evolution of sophisticated attacks
- Run inference on attack stages using the extended factor graph
Project Deliverables
| Checkpoint | Deadline | Deliverables |
|---|---|---|
| CP1 | 04/16/2021 | 1. ipynb notebook including tasks 0, 1, and 2 2. PDF of Powerpoint presentation (template will be attached below) |
| Final | 05/03/2021 | 1. ipynb notebook including all tasks 2. PDF of Powerpoint presentation (template will be attached below) |
Project Dataset
Dataset used in this MP. You might need to right click and “save as”.
http_df.csv
http2_df.csv
dns_df.csv
df_log.csv
training.csv
Project Checkpoint Templates
MP3 CP1 Template
MP3 Final CP Template
Project Code Templates
MP3 Task 3, 4 IPython Notebook (right click and save as *.ipynb format)
Background
Attack Description
The attack consists of three main attack stages:
- Remote code execution vulnerability in Apache Struts (CVE-2017-5638), https://cve.mitre.org/cgi-bin/cvename.cgi?name=CVE-2017-5638
- Local privilege escalation exploit (CVE-2016-5195), and
- A kernel module backdoor for stealthy communications
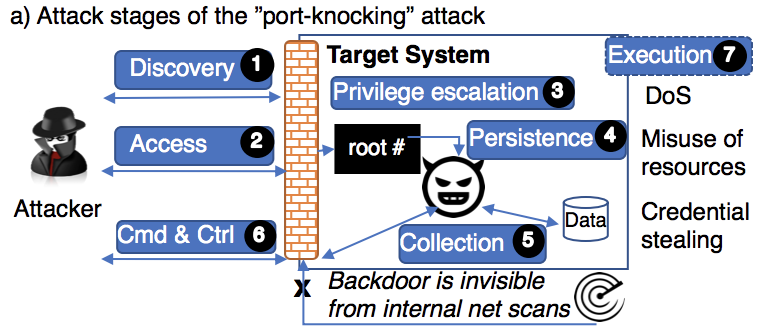
Attack stages, security events, and logs observed by security monitors on a target systems. The actual logs in the provided dataset might be slightly different.
These three main stages can be further broke down to seven finer stages (as shown in the picture above):
| Stage No. | Stage Name | Attacker Action |
|---|---|---|
| 1 | Discovery | Scan for a vulnerable web server |
| 2 | Access | Login to the vulnerable server |
| 3 | Privilege Escalation | Escalate privilege to the super user |
| 4 | Persistence | Install a new system service |
| 5 | Collection | Collect a secret key |
| 6 | Cmd & Ctrl | Run additional commands |
| 7 | Exfiltration | Extract the secret key |
Attack stages and attacker’s actions performed at each stage.
Attacker Actions
Stages 1-2 The attack starts in the discovery stage (1), where an attacker repetitively scans for vulnerable Apache Struts portals (CVE-2017-5638). These scans do not require immediate action from security operators because the scans have not affected the system. The attack then progresses to the access stage (2) where the attacker obtains a remote shell terminal by exploiting the vulnerability (CVE-2017-5638).
Stages 3-4 After establishing a foothold in the system, the attacker executes commands with superuser permissions (i.e., the privilege escalation stage (3)) as the web server runs with as root. The attacker proceeds to the persistence stage (4), where he/she downloads a file with a sensitive extension, e.g., .c, which is commonly seen in both legitimate users and malicious activities. The source file is used to compile and to install a new kernel module. At this persistence stage (4), the ongoing attack needs an immediate defensive response since the attacker can maintain persistent access to the compromised system using a backdoor which provides a secret communication channel.
Stages 5-7 The attacker then collects secret keys, i.e., Secure Shell keys such as RSA keys in the collection stage (5). Using the backdoor, the attacker sends additional commands in the command & control stage (6) to establish a DNS tunnel using the persistent module and the backdoor. Then, the secret keys are extracted in the exfiltration stage (7). Secret keys of a user for generating user specific signatures. Using secret keys the attacker can pretend to be a legitimate user and cause harm.
Terminology
Here we list the definitions of the terminologies used in this MP for clarification. You may not need to understand all of them to solve the MP.
TCP/IP: TCP stands for Transmission Control Protocol; a protocol governs internet connection establishment and data transfer. IP stands for Internet Protocol; the principal communication protocol for relaying data. Together they define a protocol for internet data exchange between different entities.
UDP: User Datagram Protocol that has similar functionality as the TCP/IP but a more lightweight version without guarantee of delivery, ordering, or duplicate protection.
DNS: Domain Name System, a system translating domain names such as llinois.edu to the actual IP address using that domain name.
HTTP: Hypertext Transfer Protocol, an application-layer protocol for transmitting hypermedia documents such as HTML webpage. HTTP follows a standard client-server model.
HTTPS: Hypertext Transfer Protocol Secure, an extension of the HTTP protocol used for secure communication.
SSH: Secure Shell Protocol, a network protocol for operating system services securely over the network, often used for remote terminal login.
HTTP GET/POST: GET method requests data from the server/source, and POST method sends data to the server to create/update a resource.
Filesystem: A filesystem controls file store and file access. Modern Linux uses ext3 or ext4 filesystems with a tree-like structure to handle directories and files.
Privilege escalation: A malicious user behavior that gains elevated permission to access the resources that are normally protected by the system. Such resources includes important system configuration, user credentials, key pairs, important protected files, etc.
Root-kits: A collection of malicious computer software that perform privilege escalation.
Remote Code Execution: A malicious user executes unauthorized code on the vulnerable machine that is targeted.
Intrusion Detection System: The IDS is a system that monitors network traffic for suspicious activity and alerts the admin if such activity is discovered.
Dataset
Here we describe the dataset used in this MP. Some of the following files are tab separated, while others are comma separated data field, so make sure the data is loaded appropriately using the correct separator into a Pandas Dataframe.
HTTP Dataframes: http_df.csv and http2_df.csv are HTTP network trace dataframes that record the transmission of the network packets. Its fields are listed below.
- timestamp: the timestamp that the packet is recorded over the network
- length: number of bytes
- highest_layer: the protocol of the highest layer of the packet
- host_ip: the IP address of the sender
- dest_ip: the IP address of the receiver
- host_port: the port of the sender
- dest_port: the port of the receiver
- http_req_uri: the requested URI
- content-type: part of the HTTP header that is used to indicate the media type of the request resource
DNS Dataframe: dns_df.csv contains the DNS dataframe that records the DNS requests. Its fields are listed below.
- timestamp: the timestamp that the request is recorded over the network
- length: number of bytes
- highest_layer: the protocol of the highest layer of the request
- host_ip: the IP address of the sender
- dest_ip: the IP address of the receiver
- host_port: the port of the sender
- dest_port: the port of the receiver
Training Dataset: training.csv contains the observed events and the state of the system when those events are observed. For example, the first data entry: “Scan, attack” means a scan event was observed when the system was in the attack state. Its fields are listed below.
- Event: the event or the event sequence observed, if a sequence is observed the sequence is quoted.
- State: the state of the system
System Log Dataframe: df_log.csv contains the system logs recorded during the attack. The log entries in this file may or may not be relevant to the attack. Also, not all fields (columns) are relevant to solving the MP. The fields that are more relevant to this MP are listed below.
- name: the name of the event, for example, “kernel module” indicates a event related to kernel model
- action: the high-level action taken on the file, for example “added” of a “kernel module”-related event means the high-level action is adding a kernel model
- columns.name: the file involved in that event, not to confuse with the event name
- decorations.username: the user that performs the action
- columns.targetpath: the targeted file that is monitored
Note that other fields may also be useful so you should take a look at the entire dataframe and understand what it means and make your own judgement.
Project Tasks
Task 0 - Introduction & Data Preprocessing
In this task, you should familiarize yourself with the following networking and operating system concepts.
- Networking protocols - TCP/IP, UDP, DNS, HTTP, HTTPS, SSH
- Network Paths, HTTP GET, POST requests, HTTP Secure (Secure Socket Layer SSL/ Transport Layer Security TLS)
- Operating Systems - Filesystem layout, system logging mechanisms
- Security - Privilege escalation, root-kits, remote code execution, Intrusion Detection System (IDS)
- One of the HTTP network trace dataframes (
http_df.csvorhttp2_df.csv) corresponds to legitimate network activity, and the other one is the attacker’s network activity. According to the description of CVE-2017-5638, the attacker network activity contains a "#cmd” string in Content-Type. Using this clue, identify which of the two network trace dataframes represents legitimate activity, and which represents attacker’s activity.
Task 1 - Detecting the attack using conditional probability
In this task, the problem is to detect the attack using alerts (also refer to as “events”) from monitoring data.
The intuition is:
i) High-impact attacks evolve gradually, causing visible traces of alerts prior to causing permanent damage. ii) An alert is unlikely to occur by chance.
Your goal in this task is to quantify the conditional probability of an attack given alerts observed from the data. You will be using training data (training.csv). The training data is a dataset of alerts observed during normal operation (benign) and attack. Multiple alerts during an attack are grouped together in a string and separated by a comma, see the Dataset Description section for details.
Use the training data to answer the following questions.
-
Calculate the probability of an attack: P(Attack)
-
Calculate the probability of normal operation (benign): P(Benign)
-
Calculate the conditional probability of an attack given an individual alert. a. P(Attack | A1 = Scan) b. P(Attack | A2 = SensitiveURI) c. P(Attack | A3 = New_Kernel_Module)
-
Calculate the conditional probability of an attack given the sequence of two alerts: Login and SensitiveURI a. P(Attack | A1 = Scan, A2 = SensitiveURI)
-
Calculate the conditional probability of an attack given the sequence of three alerts: Scan, SensitiveURI, and New_Kernel_Module a. P(Attack | A1 = Scan, A2 = SensitiveURI, A3 = New_Kernel_Module)
Suppose at runtime you observed a sequence of three alerts “Scan, SensitiveURI, New_Kernel_Module”. Use your calculated probabilities to answer the following questions about the attack at runtime.
-
Plot the three conditional probabilities: P(Attack | A1 = Scan) , P(Attack | A1 = Scan, A2 = SensitiveURI), P(Attack | A1 = Scan, A2 = SensitiveURI, A3 = New_Kernel_Module) on a stair-case graph: X axis are alerts “A1”, “A1 A2”, “A1 A2 A3” and Y axis is the probabilities.
-
Given a pattern of alerts, how would you assess if the observed pattern of the alerts is related to the attack, i.e., it forebodes the attack? Use proper statistical methods, state your steps, and evaluate the observed sequence “A1 = Scan, A2 = SensitiveURI, A3 = New_Kernel_Module”.
Task 2 - Data Exploration/Forensics Prior To Building a Machine Learning Model
Security analysts and attackers both frequently study network traffic to search for vulnerabilities and to characterize network behaviors. In this section, you will examine network traces from a sample network we set up for this assignment to compare the attacker’s behavior vs the legitimate users’ behavior. Additionally, you will evaluate a simple critical alert-based detector.
Use the attacker HTTP dataframe from Task 0 for the following tasks.
HTTP Traffic Analysis (Attack Stages 1-2)
- CVE-2017-5638 (related to this attack) discloses that a scan is initiated by querying the /showcase.action request URI. A vulnerable server responds to this scan with a response code (HTTP/1.1 200 OK) and following HTTP header:
Server: Apache-Coyote/1.1
<some payload>
a. What is the UNIX timestamp of the first attempted scan on the vulnerable server?
b. What is the IP address of the vulnerable server?
c. What is the port of the vulnerable server?
-
The attacker crafts malicious HTTP requests to access and exploit the vulnerable server. Such requests have abnormally long strings in their Content-Type headers because the attacker embeds malicious commands in such headers. Such commands allow the attacker to complete later stages of the attack.
a. Extract a list of the Content-Type headers sent to the vulnerable server from the provided HTTP network trace dataframe. For each Content-Type header, provide its length.
b. Fill in the blanks in the table below. You may want to refer to UNIX man pages or this website for the commands in the table. Identify in the table below which of the UNIX commands are present in the extracted Content-Type headers by searching for the "#cmd=” string field. Not all commands in the table are part of the attack. Put Yes/No for the presence of the command in the table below. Interpret the functions of the identified commands, i.e., how the command helps an attacker achieve their objective. Note: Only provide the interpretation of the command if the command is present in the attack.
| Command Name | Present in the attack? | Interpretation of the command |
|---|---|---|
| whoami | Yes | Displays the name of the current user |
| wget | ||
| ls | ||
| cat | ||
| cd | ||
| insmod | ||
| ssh | ||
| lsmod |
Host Logs Analysis (Attack Stages 3-5)
Since the server software runs as root, any commands embedded in HTTP GET requests by an attacker will execute with superuser/root privileges (Stage 3: Privilege Escalation). After exploiting the vulnerable server, the attacker installs a rootkit as a new kernel module (Stage 4), and accesses the folder (.ssh) containing the secret key (id_rsa) and the list of known hosts on the vulnerable server (Stage 5).
Using the system logs dataframe(df_log.csv) answer the following questions:
-
Analyze kernel-related activities (Stage 4: Persistence)
a. Provide a list of kernel modules added or removed from the system
b. Identify the attacker-controlled kernel module Hint: The kernel module (*.ko) was downloaded via a GET request that you extracted in Task 2.2a
c. Verify that the kernel module that the attacker obtained in Task 2.2a has been loaded into the vulnerable server. Provide evidence. Hint: look for the relevant entries in thedf_log.csvthat contains the name of the kernel module, what can you say about the loaded kernel module?
DNS Traffic Analysis (Attack Stages 6-7)
After getting the secret key, the attacker establishes a DNS tunnel to a remote server (Stage 6: Command and Control), and uploads this secret key to the remote server to avoid detection by traditional Intrusion Detection Systems (Stage 7: Ex-filtration).
Using your DNS dataframe, perform the following tasks:
-
There are two DNS servers accepting DNS queries in the provided DNS network trace
dns_df.csv.a. Identify the attacker-controlled DNS server
b. Identify the legitimate DNS server
Hint: The attacker-controlled DNS server is behind the same network that hosts the kernel module in the HTTP task (Task 2.2a).
Building a simple detector based on critical alerts
Having finished analyzing attack data, you have a good understanding of the attacker’s behaviors and legitimate user’s behaviors. There are many alerts in this attack that can offer detection. For the purpose of this task, we will build a simple detector based on critical alerts. A critical alert is defined as an alert of irreparable damage, i.e., secret key extraction that will eventually be exposed to the public and thus cannot be undone. We suspect that the attacker can encode the secret key into DNS queries for exfiltration. Thus, these malicious queries are longer than legitimate queries. During data exfiltration, there are more malicious queries compared to legitimate queries.
-
Using the DNS network trace dataframe, answer the following questions.
a. Count the number of DNS queries to the legitimate DNS server (nDnsLegitimate) and the attacker-controlled DNS server (nDnsAttack)
b. Calculate the ratio of nDnsLegitimate/nDnsAttack. This ratio shows the burst of critical alerts during data exfiltration.
c. Plot a histogram of the length of DNS queries for the two DNS servers on the same plot. Clearly label the two servers using different colors. Use log scale for the count on the Y axis. What do you observe?
Next, you will build a simple detector based on critical alerts and evaluate its performance. The detector uses the length of the DNS queries — any DNS query that has a packet-length of more than 87 bytes is categorized as malicious. On the other hand, any query that has a packet-length of less or equal to 87 bytes is categorized as legitimate. We suspect these long DNS queries are related to the attack. Compute the following. Evaluate the performance of this simple detector.
-
Calculate the false positive rate. i.e., the fraction of legitimate queries that were categorized as malicious.
-
Calculate the false negative rate. i.e., the fraction of malicious queries that were categorized as legitimate.
-
To put their accuracy in perspective, consider a system that has a million legitimate DNS query per day, has no real attack, and has a team of 5 people working 8 hours a day looking at the alerts. On average it takes 20 minutes to investigate one false positive. Using the calculated false positive rate above, answer following questions.
a. How many hours would it take for the team to investigate all false positives?
b. Would the team be overwhelmed by the false positives?
-
Can these critical alerts stop secret keys from being extracted? Explain.
-
Suppose the threshold of 87 is not given to you. How would you find the threshold for the detector? Find the threshold based on your procedure and evaluate the false-positive rate and the false-negative rate of the detector based on your threshold.
Task 3 - Introduction to Programming Factor Graphs
In this task, you will construct a simple factor graph using one event ($E_1$ - Scan) observed during Stage 1 in the attack scenario above. Your task is to infer the hidden attack stage $S_1$ using the provided factor functions.
Before beginning with this task, familiarize yourself with the following concepts:
- Probabilistic Graphical Models - Factor Graphs, Factor Functions
- Inference on Graphical Models - Brute-force, Message Passing
Task 3 Setup
This task requires the pgmpy library, which is available in Python 3. You can install it with pip command
pip install pgmpy
Verify that pgmpy has been installed using
import pgmpy
If the command succeeds without an ImportError or ModuleNotFoundError, you have successfully set up pgmpy on your machine.
Building a simple factor graph for an attack
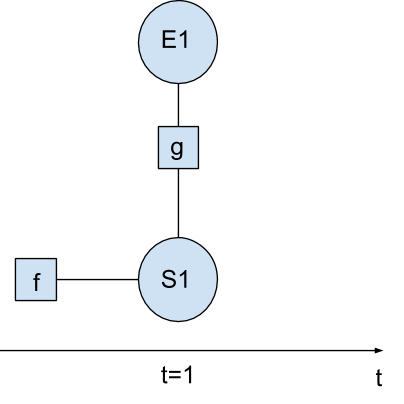
Let’s consider the attack in the previous task. At time step t=1, a security event $E_1$ (Scan) is observed and the corresponding stage $S_1$ is unknown to be a real attack or benign activity. In this task, both the event and the attack stages are indicated by binary variables. The event has a value 1 that indicates a scan for vulnerabilities and 0 otherwise. The attack stage has a value 1 that indicates an attack and 0 otherwise.
A simple factor graph of the event $E_1$ and the attack stage $S_1$ is shown below. Two factor functions: a prior on the stage $f(S_1)$ and a factor function $g(E_1, S_1)$ are provided as well. The factor graph represents the joint probability distribution: $$ P(E_1, S_1) = \frac{1}{Z} f(S_1) g(E_1, S_1)$$
where $Z = \sum_{E_1\in{0,1}, S_1\in{0,1}}f(S_1)g(E_1, S_1)$ is the normalization factor.
Task 3 Factor Graph
| Event | Value | Description |
|---|---|---|
| $E_1$ | 0 | no scan |
| 1 | scanning activity is observed |
| Stage | Value | Description |
|---|---|---|
| $S_1$ | 0 | no attack |
| 1 | an attack is in progress at the discovery stage |
| $S_1$ | $f(S_1)$ |
|---|---|
| 0 | $0.85$ |
| 1 | $0.15$ |
| $S_1$ | $E_1$ | $g(S_1, E_1)$ |
|---|---|---|
| 0 | 0 | $0.1$ |
| 0 | 1 | $0.2$ |
| 1 | 0 | $0$ |
| 1 | 1 | $0.5$ |
Using the provided template code:
- Build the factor graph by completing the given template code.
- Compute the marginal probability $P(S_1)$. According to your results, what value of $S_1$ maximizes the marginal probability $P(S_1)$?
- Suppose you have already observed the event $E_1=1$, computer the probability $P(S_1|E_1)$. What’s the most probable state of $S_1$ when observing $E_1=1$?
Task 4 - Inference for a factor graph of the Equifax attack scenario
In this task, you will construct a complete factor graph that models the Equifax attack scenario using the events observed in previous tasks. The goal is to infer the hidden attack stages using provided factor functions.
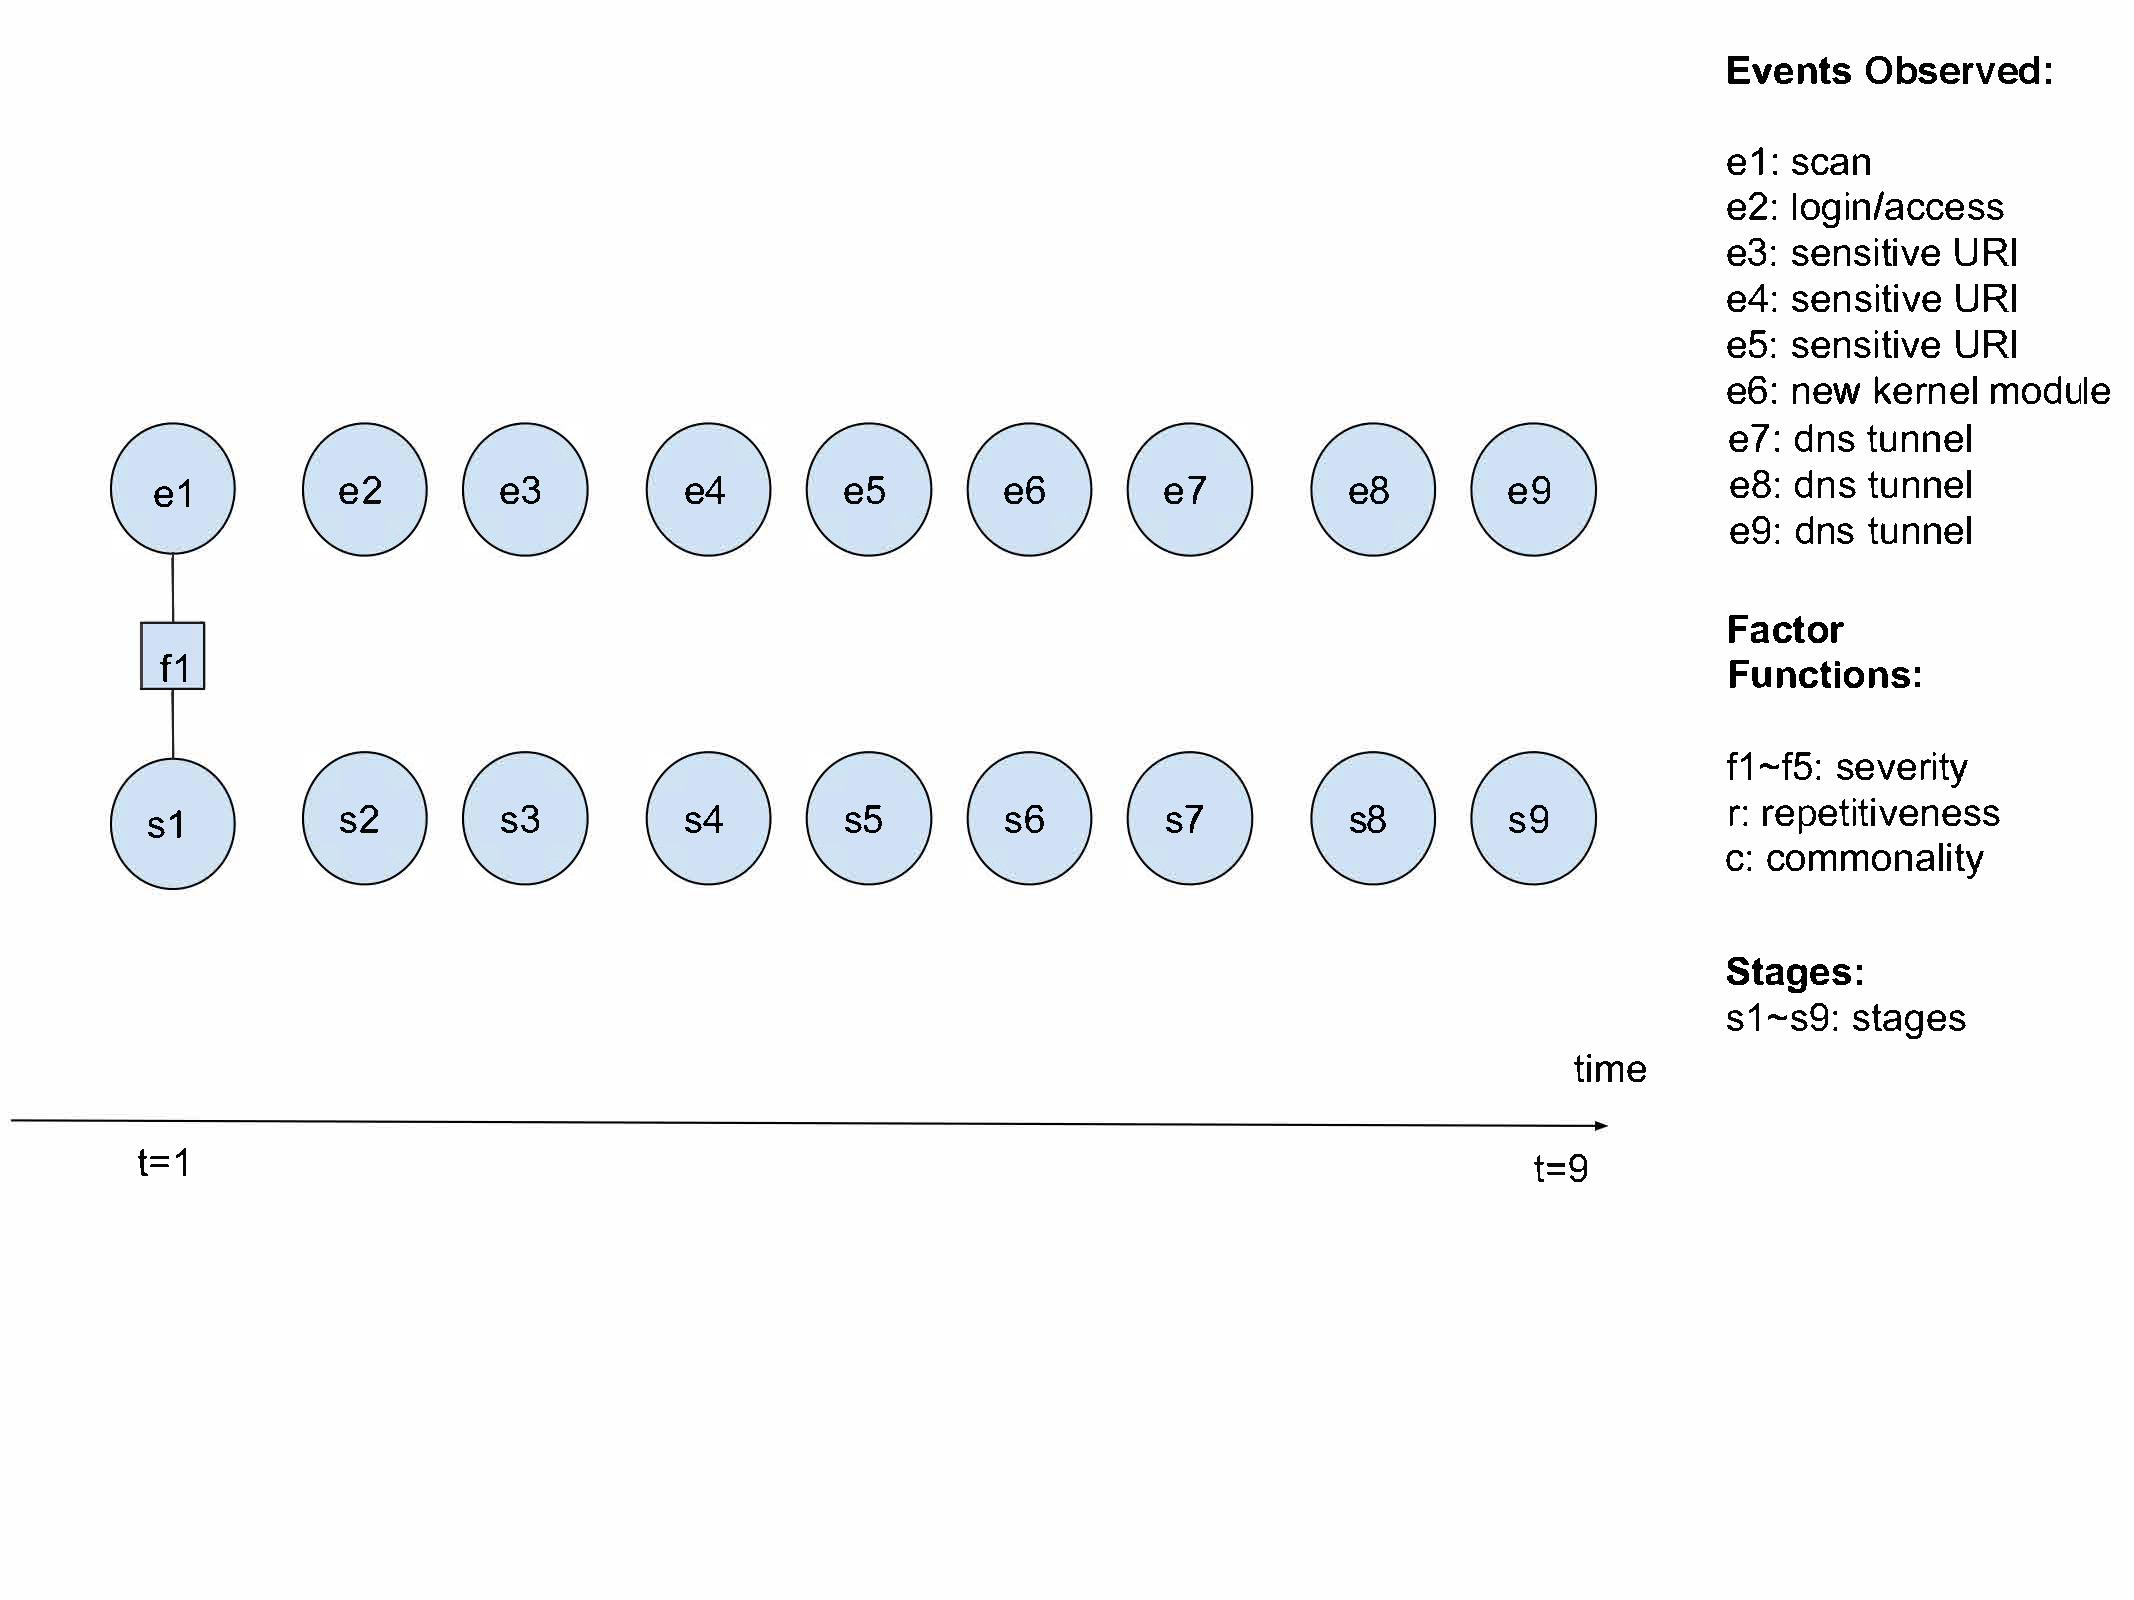 Task 4 Factor Graph
The variable nodes in the factor graphs consist of events ($e_t$) and (hidden) stages ($s_t$) where $t$ is the time. Factor functions connect events and stages with each other. As a new event occur, the factor graph expands to include the new event, its corresponding stage, and the relevant factor functions. Using this factor graph, at each stage, you estimate the hidden attack stage.
Each event $e_t$ may take on any of the following values:
- $\epsilon_1$ - Scan
- $\epsilon_2$ - Login
- $\epsilon_3$ - Sensitive URI
- $\epsilon_4$ - New Kernel Module
- $\epsilon_5$ - DNS Tunneling
Each stage $s_t$ could assume any of the following 11 states at each time step:
- $\sigma_1$ - Benign
- $\sigma_2$ - Discovery
- $\sigma_3$ - Access
- $\sigma_4$ - Lateral Movement
- $\sigma_5$ - Privilege Escalation
- $\sigma_6$ - Persistence
- $\sigma_7$ - Defense Evasion
- $\sigma_8$ - Collection
- $\sigma_9$ - Exfiltration
- $\sigma$10 - Command and Control
- $\sigma$11 - Vulnerable Code Execution
Choosing factor functions is a table look-up based on the table below.
We will model our factor graph with factor functions as follows:
- $f_1$ to $f_5$ are severity factor functions corresponding to each event $\epsilon_1$ to $\epsilon_5$. For e.g., if $e_1 = \epsilon_1$, $f_1$ connects $e_1$ to $s_1$.
- $c$ is a commonality factor function which connects events $\epsilon_1, \epsilon_3$ and $\epsilon_4$. For e.g., if $e_1=\epsilon_1, e_2=\epsilon_3, e_3=\epsilon_4$, then $c$ connects $e_1, e_2, e_3$, and $s_3$.
- $r$ is a repetitiveness factor function which connects three successive “Sensitive URI” and the stage corresponding to the latest “Sensitive URI” alert.
- $h_ij$ are transition factor functions connecting succesive stages.
We assume an attacker already in a stage $i$ will be more likely to stay in the same stage $i$. This assumption is reasonable. As attacks are rare events, a benign user will likely stay benign. Meanwhile, an attacker trying to extract data in the Exfiltration stage will repeatedly do so. For the purpose of this MP, we assume:
a. A stage $i$ will stay in the same stage $i$ with a probability of 0.9.
b. A stage $i$ will make a transition to any stage $j$ (j != i) with a probability of 0.01.
The goal is to infer the hidden attack stages $s_1$ to $s_9$ using your factor graph model.
Probability of past attacks for each event and their significance are given in the following tables:
| Event | Factor Function | Attack States | Significance ($p$) | Probability in past attacks ($q$) |
|---|---|---|---|---|
| Scan | $f_1$ | { discovery, benign } | { 0.03, 0.52 } | { 0.5, 0.5 } |
| Login | $f_2$ | { benign } | { 0.01 } | { 0.5 } |
| Sensitive URI | $f_3$ | { privilege escalation, benign } | { 0.015, 0.015 } | { 0.09, 0.11 } |
| New Kernel Module | $f_4$ | { persistence, benign } | { 0.005, 0.03 } | { 0.07, 0.09 } |
| DNS Tunneling | $f_5$ | { benign, exfiltration } | { 0.08, 0.004 } | { 0.16, 0.18 } |
Table of events, stages, q and p values for factor functions $f_1 - f_9$ (severity)
| Event Sequence | Factor Function | Attack States | Significance ($p$) | Probability in past attacks ($q$) |
|---|---|---|---|---|
| {Scan, Sensitive URI, New Kernel Module} | $c$ | persistence | 0.006 | 0.15 |
Table of events, stages, q and p values for factor function $c$ (commonality)
| Event Sequence | Factor Function | Attack States | Significance ($p$) | Probability in past attacks ($q$) |
|---|---|---|---|---|
| {Sensitive URI, Sensitive URI, Sensitive URI} | $r$ | privilege escalation | 0.05 | 0.15 |
Table of events, stages, q and p values for factor function $r$ (repetitiveness)
Probability values for each factor function is specified as an 11 dimensional vector, with each cell representing its corresponding attack stage. The probability of a stage is given by $q \times (1-p)$. For stages not present in an event, its corresponding probability is 0.
For example, the probability vector for factor function $f_1$ is
$$[0.5 \times (1 - 0.52) , 0.5 \times (1 - 0.03), 0, 0, 0, 0, 0, 0, 0 ,0 ,0]$$
since only attack states $\sigma_1$ (benign) at index 0 and $\sigma_2$ (discovery) at index 1 are defined for Scan ($\epsilon_1$) .
Based on the inference of the stage, an action is taken. A table containing action probabilities for each stage is given below. Your Factor Graph model should pick the appropriate action for each stage of the attack that it encounters.
For each time step, just use the most probable stage for the action picking. While you could build complex models using these probability values, simply picking the argmax for each stage should suffice for this project.
| Stage Name | No-Op Action | Monitor Action | Stop Attack Action |
|---|---|---|---|
| Benign | 1.00 | 0.00 | 0.00 |
| Discovery | 0.61 | 0.39 | 0.00 |
| Access | 0.69 | 0.31 | 0.00 |
| Lateral Movement | 0.09 | 0.84 | 0.07 |
| Privilege Escalation | 0.20 | 0.63 | 0.17 |
| Persistence | 0.00 | 0.70 | 0.30 |
| Defense Evasion | 0.00 | 0.07 | 0.93 |
| Collection | 0.00 | 0.10 | 0.90 |
| Exfiltration | 0.00 | 0.00 | 1.00 |
| Command and Control | 0.00 | 0.00 | 1.00 |
| Execution | 0.00 | 0.00 | 1.00 |
-
Complete the factor graph shown in Task 4 Factor Graph. Include this factor graph in your submission.
-
Infer the hidden attack stage corresponding to each time point from $t=1$ to $t=9$. Provide the probability of each stage given the observations and the most probable stage for each time point.
-
What action should your model recommend for each time point? What is the earliest time point in which your model should recommend stopping the attack?
-
Assume that DNS Tunneling is a critical alert and the packet length is greater than 87 bytes. Is the factor graph model better than the critical alert detector described in Task 2 in preempting the attack?
-
Investigate what events trigger the FG detection of the attack. Our approach is to divide the events in the attack into subsets that are mutually exclusive. We will evaluate the FG detection on each subset to conclude which subset trigger the detection.
a. Experiment 1: Consider an attack A1 with only a subset of five events: [“Scan”, “Login”, “DNS\ Tunneling”, “DNS\ Tunneling”, “DNS\ Tunneling”] Scan, and Login events are related to legitimate users. DNS Tunneling is an event that is inconclusive if being observed by itself. Perform the inference on this new factor graph that only uses the above subset of events and infer the hidden attack stage corresponding to each time point. What is the earliest time point in which your model should recommend stopping the attack? Hint: Note that in this experiment not all factor functions we mentioned before would apply.
b. Experiment 2: Consider an attack A2 with only a subset of events: [“Scan”, “Sensitive\ URI”, “New\ Kernel\ Module”] Perform the inference on this new factor graph that only uses the above subset of events and infer the hidden attack stage corresponding to each time point. What is the earliest time point in which your model should recommend stopping the attack? Hint: Note that in this experiment not all factor functions we mentioned before would apply.
c. Compare the probability of each attack state on each experiment. Which experiment triggers the detection? Explain why?
-
We will compare using an HMM to model this attack scenario vs using an FG. Note that the stage-action table is not included in the HMM.
a. Draw an HMM model for the attack scenario given the provided states and events.
b. What parameters are needed for this HMM model to work?
c. Give an example of an advantage of the FG over the HMM model.