Next: 10 Conclusions and Future Up: 9.2 Experimental Results Previous: 9.2.1 Desorption Rates Contents
Looking at particle densities at a fixed temperature yields similar insights as looking at the desorption rates. However a few things become clearer using the particle densities.
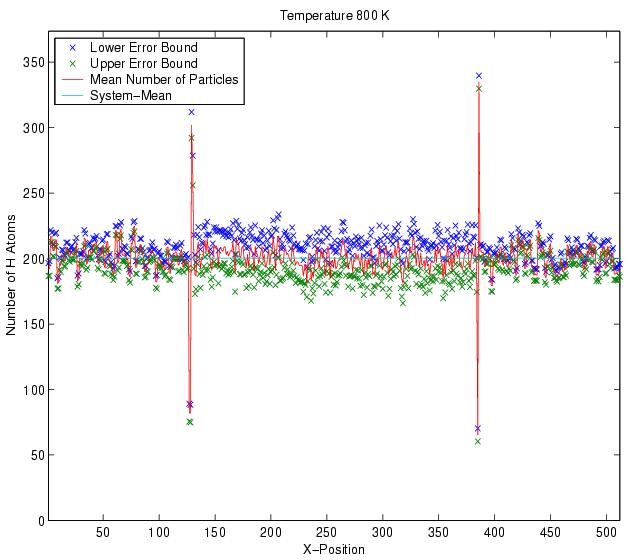
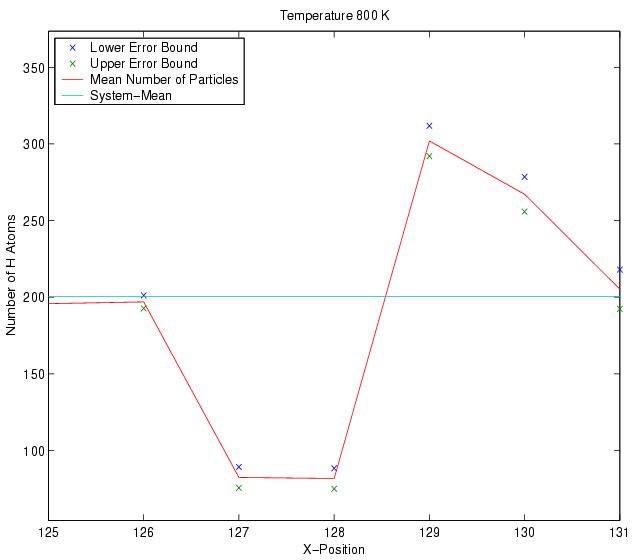
Figure 13 shows the number of H-atoms left after 10 million timesteps at 800K. This graph looks very similar to the corresponding desorption rate graph (Figure 10). Zooming in on A-step however (Figure 14), confirms the hypothesis made in Section 9.2.1 -- note that the particle concentrations are very low at the top of the A-step (sites 127 and 128) and very high near the bottom (sites 129 and 130). This goes a long way to explaining the increased desorption at these sites.
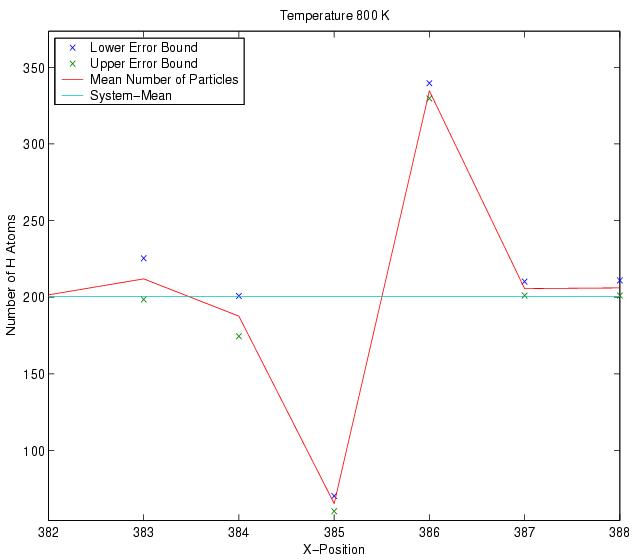
Near the B-step (Figure15) we also see the hypotheses of Section 9.2.1 confirmed. At the base of the B-step (site 386) we see a very high particle concentration (which doesn't tail off quickly over time, since we've a priori disallowed desorption from that area). Likewise, the particle concentration at the top of the B-step (site 385) is very low, which explains why the desorption rate is low at such a high-energy site.