Bayes nets (a type of Graphical Model) compactly represent how variables influence one another Here's a Bayes net with five variables.
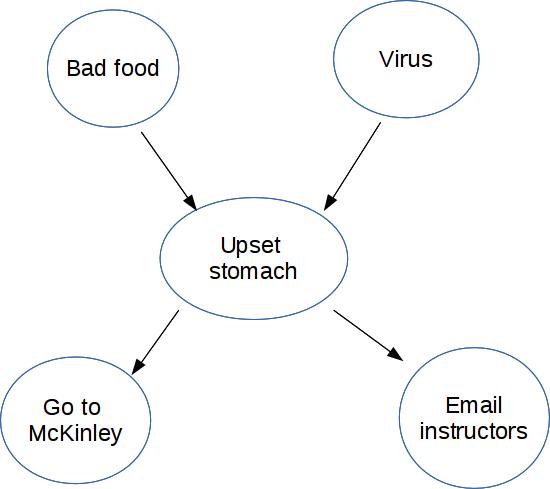
For simplicity, suppose these are all boolean (T/F) variables.
Notice that this diagram shows the causal structure of the situation, i.e. which events are likely to cause which other events. For example, we know that a virus can cause an upset stomach. Technically the design of a Bayes net isn't required to reflect causal structure. But they are more compact (therefore more useful) when they do.
For each node in the diagram, we write its probability in terms of the probabilities of its parents.
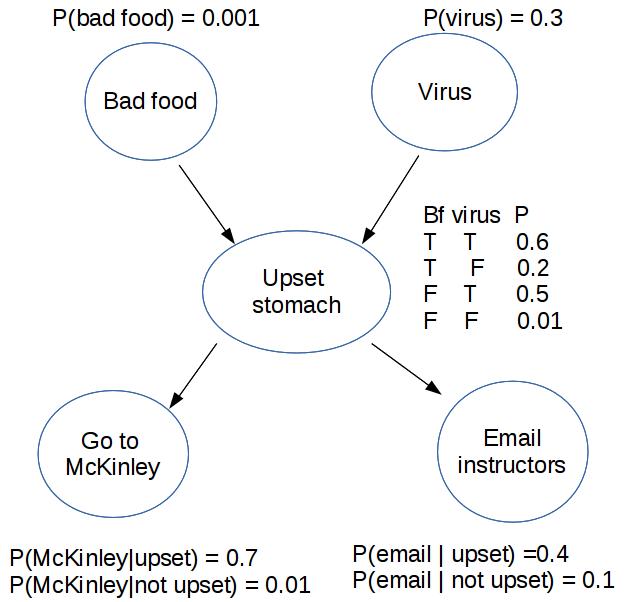
"Bad food" and "Virus" don't have parents, so we give them non-conditional probabilities. "Go to McKinley" and "Email instructors" have only one parent, so we need to spell out how likely they are for both possible values of the parent node.
"Upset stomach" has two parents, i.e. two possible causes. In this case, the two causes might interact. So we need to give a probability for every possible combination of the two parent values.
A and B are independent iff P(A,B) = P(A) * P(B)
A and B are conditionally independent given C iff
P(A, B | C) = P(A|C) * P(B|C)
equivalently P(A | B,C) = P(A | C)
equivalently P(B | A,C) = P(B | C)
Two effects with a common cause:

Busy piazza and busy office hours aren't independent, but they are conditionally independent given that there's a project due.
Two causes with common effect.
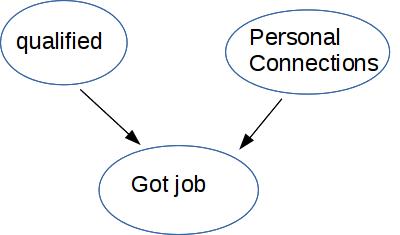
Being qualified is independent of having personal connections (more or less) But they aren't conditionally independent given that the person got the job. Supppose we know that they got the job but weren't qualified, then (given this model of the causal relationships) they must have personal connections.
This is called "explaining away" or "selection bias."
A causal chain:
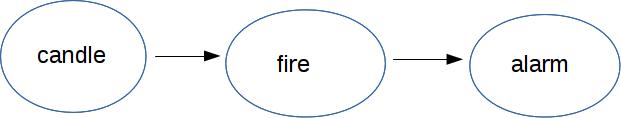
Candle and alarm are conditionally independent given fire. But they aren't independent, because P(alarm | candle) is much larger than P(alarm).
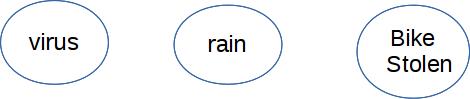
A set of independent variables generates a graphical model where the nodes aren't connected
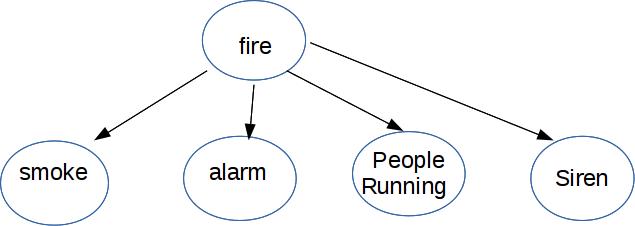
One ancestor (cause), a number of children (effects)
Recall from discrete math: a partial order orders certain pairs of objects but not others It has to be consistent, i.e. no loops. So we can use it to draw a picture of the ordering with ancestors always higher on the page than descendents.
The arrows in a Bayes net are like a skeleton of a partial order: just relating parents to their children. The more general ancestor relationship is a true partial order.
For any set with a partial order, we can create a "topological sort." This is a total/linear order of all the objects which respects the partial order. That is, a node always follows its ancestors. Usually there is more than one possible topological sort and we don't care which one is chosen.
A Bayes net is a directed acyclic (no cycles) graph (called a DAG for short). So nodes are partially ordered by the ancestor/descendent relationships.
Each node is conditionally independent of its ancestors, given its parents. That is, the ancestors can ONLY influence node A by working via parents(A)
Suppose we order the nodes in a way that's consistent with the arrows (aka a topological sort). Then we have an ordered list of nodes \( X_1, ..., X_n\). Our conditional independence condition is then
For each k, \(P(X_k | X_1,...,X_{k-1}) = P(X_k | \text{parents}(X_k))\)
We can build the probability for any specific set of values by working through the graph from top to bottom. Suppose (as above) that we have the nodes ordered \(X_1,...,X_n\). Then
\( P(X_1,...,X_n) = \prod_{k = 1}^n P(X_k | \text{parents}(X_k)) \)
\( P(X_1,...,X_n) \) is the joint distribution for all values of the variables.
In \( \prod_{k = 1}^n P(X_k | \text{parents}(X_k)) \), each term \( P(X_k | \text{parents}(X_k)) \) is the information stored with one node of the Bayes net.
In this computation, we're starting from the causes (also called "query variables") such as bad food and virus above. Values propagate through the intermediate ("unobserved") nodes, and eventually we produce values for the visible effects (go to McKinley, email instructors). Much the time, however, we would like to work backwards from the visible effects to find the most likely cause(s).
Suppose we have n variables. Suppose the maximum number of parents of any node in our Bayes net is m. Typically m will be much smaller than n.
Somewhat successful classification of news sites into fake/reliable