import random
import matplotlib.pyplot as plt
%matplotlib inline
import numpy as np

import scipy.io.wavfile as wav
import IPython.display as ipd
Some introductory functions
List comprehensions
List comprehensions are a versatile syntax for mapping a function (or expression) across all elements of a list. Read the function below. Do you understand what is happening with the arguments and retun values?
# The function below accepts a list L
# and returns another list with elements of L three times as large
def three_ize(L):
    # this is an example of a list comprehension
    LC = [3 * x for x in L]
    return LC
What is the return value of three_ize(list1)?
list1 = [1,4,5,10]
Write the function scale
The function should have the following signature:
def scale(L, scale_factor):
    '''
    returns a list similar to L, except that each element has been
    multiplied by scale_factor.
    '''
Now you can use the function scale with the given variable list
Write the function add_2:
The function should have the following signature:
def add_2(L, M):
    '''
    takes two lists L and M and
    returns a single list that is an element-by-element sum of the two arguments
    If the arguments are different lengths, the function add_2 should
    return a list that is as long as the shorter of the two.
    Just ignore the extra elements from the longer list.
    '''
Define two lists, and use your function add_2
Write the function add_scale_2:
The function should have the following signature:
def add_scale_2(L, M, L_scale, M_scale):
    '''
    takes two lists L and M and two floating-point numbers L_scale and M_scale.
    These stand for scale for L and scale for M, respectively.
    Returns a single list that is an element-by-element sum of the two inputs,
    each scaled by its respective floating-point value.
    If the inputs are different lengths, your add_scale_2 should return a list that is
    as long as the shorter of the two. Again, just drop any extra elements.
     '''
What is the result of
L1 = [1,3,5,2]
L2 = [3,1,4,4]
add_scale_2(L1,L2,2,3)
How can you obtain the same result using numpy arrays?
Define two numpy arrays and perform the same operation defined by the function add_scale_2
Helper function add_noise
Take a look at the function below. What is happening to the scalar argument x?
def add_noise(x, chance_of_replacing, noise):
    """add_noise accepts an original value, x
       and a fraction named chance_of_replacing.

       With the "chance_of_replacing" chance, it
       returns the number x + noise

       Otherwise, it should return x
    """
    r = random.uniform(0, 1)
    if r < chance_of_replacing:
        return x + noise
    else:
        return x
Create the function array_add_noise
Create a function array_add_noise that replace entries in a numpy array L using the helper function above. Entries in the array should be replaced with probability prob
def array_add_noise(L,prob,noise):
    '''takes a 1D numpy array L,
    and modify entries of L using the helper function add_noise
    Note that this function should not return a new object,
    it should instead modify the given object
    '''
You are given the numpy array:
L = np.array([4,2,5,6,9],dtype=float)
What happens to L after you call the function array_add_noise? Print L and id(L) before and after the function call.
Modify the function array_add_noise defined above to take an optional parameter inplace which by default is True.
When inplace is False, the function will create a new numpy array and return it with the modified values, but it won't replace the entries in the original array.
Use the updated array_add_noise function to:
1) modify a given numpy array inplace
2) create a new numpy array
Print the numpy array before and after the function call. Print the id. What do you observe?
Let's start playing with sounds
Create a sinusoidal sound
# Define the duration of the sound we want to create:
# duration in seconds
duration = 5
# Define the rate of the sound, which is the number of sample points per second
DEFAULT_RATE = 44100
# The total number of sample points that define your sound is:
nsamples = int(DEFAULT_RATE*duration)
# Then create a numpy array that define the range of the sound, i.e.,
# nsamples points equaly spaced in the range (0,duration) [s]
t = np.linspace(0,duration,nsamples)
Create a sound array corresponding to the function
$ f(t) = \sin(220 (2 \pi t)) + \sin(224 (2 \pi t))$
Use plt.plot(t,data) to plot your function:
Check the sound you just created!
#ipd.Audio(data,rate=DEFAULT_RATE)
You can also try different functions!
Create a music note
Let's make the sound of the A5 note. (https://en.wikipedia.org/wiki/Piano_key_frequencies)
# We want to have the note played for 0.5 seconds
duration = 0.5
# Define the rate
rate = DEFAULT_RATE
# The number of samples needed is
nsamples = int(rate*duration)
# # The frequency of A5 is 880.
freq = 880
t = np.linspace(0, duration, nsamples)
data = np.sin(freq*2*np.pi*t)
#ipd.Audio(data,rate=rate)
Write a function make_note
Just add the steps described above to define the function make_note
def make_note(freq, duration=0.3, rate=DEFAULT_RATE):
    '''
    receives as arguments:
        - frequency of the note (freq)
        - duration of the sound (set as default equal to 0.3)
        - rate (samples per second)
    and returns:
        - np.array data with the beep
    '''
Use note = make_note(...) function to create the following sounds:
| note | duration | freq |
|---|---|---|
| A4 | 3 | 440 |
| C4 | 4 | 261.6256 |
Then you can plot the sound array using:
plt.plot(note)
And listen to the sound using:
ipd.Audio(note,rate=DEFAULT_RATE)
Modify the function make_note so that it parabolically decays to zero over the time duration of the sound
We need a ramp function, which starts with value equal to 1 and finishes with value of zero, and includes nsamples data points
ramp = np.linspace(0, 1, nsamples)
Check the function that gives the linear decay:
plt.plot(1-ramp)
And also the functin that gives the parabolical decay
plt.plot((1-ramp)**2)
Modify the function make_note so that it applies the decay above to the data array
Use your function to create the note A8 (freq=7040) with duration of 2 seconds. Then plot the sound array using plt.plot(note) and listen to the sound using ipd.Audio(note,rate=DEFAULT_RATE)
Make music
You can use numpy.hstack to combine notes to make music.
Try to make a music by using the frequencies in freq_example consecutively, using the same duration for all notes. Store the combined array in the variable music.
freq_example = [261.6256,293.6648,329.6276,349.2282,391.9954,440.0000,493.8833,523.2511]
music = ...
Listen to the music you created using ipd.Audio(music,rate=DEFAULT_RATE)
What did you get?
We can make "real" music :-)
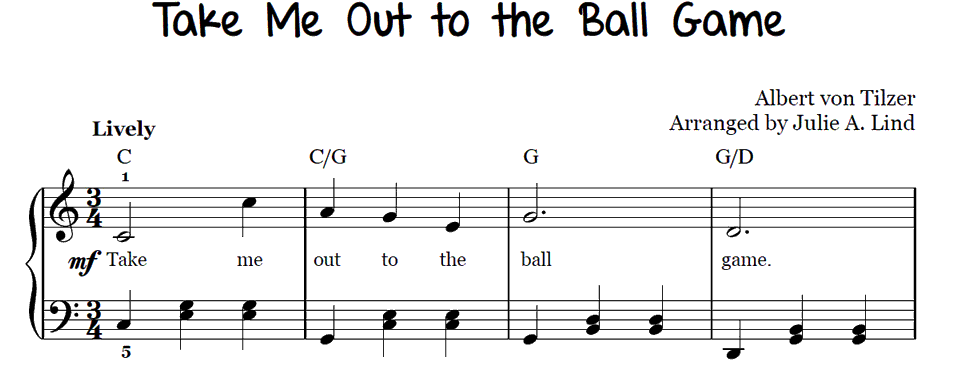
Here is how we could write the song above:
| note | duration | freq |
|---|---|---|
| C | 2 | 261.626 |
| C | 1 | 523.251 |
| A | 1 | 440.0 |
| G | 1 | 391.995 |
| E | 1 | 329.628 |
| G | 3 | 391.995 |
| D | 3 | 293.665 |
We enter the above information as a list of lists:
notes = [
    [2,261.626],
 [1,523.251],
 [1,440.000],
 [1,391.995],
 [1,329.628],
 [3,391.995],
 [3,293.665]]
where notes[i] gives the list [duration,freq] for the note i. You can again use hstack (or any other method you want) to combine the notes to make music.
Create the numpy array music using the list notes above, and play the music using
ipd.Audio(music,rate=DEFAULT_RATE)
Name the music!
I will now give you different notes, and you will tell me the name of the music.
Let's listen to movie sound clips
# Name the movie!
ipd.Audio("swnotry.wav")
# Name the movie!
ipd.Audio("honest.wav")
Inspect the type of the data in music_data
# scipy.io.wavfile.read: return the sample rate (in samples/sec) and data from a WAV file
filename = "honest.wav"
rate, music_data = wav.read(filename)
print("The sound has rate (in samples per second) = ", rate)
print("The data has", len(music_data), "sample points")
print(type(music_data))
We can also play the music_data array obtained using wav.read:
sound = np.array(music_data,dtype=float)
plt.plot(sound)
And we use the same rate to play the audio
ipd.Audio(sound, rate=rate)
Change the speed of the sound
Make it twice as fast
Make it twice as slow
Add noise to the sound
Let's modify at random some of the elements of the numpy array.
Use the function array_add_noise to create the variable noisy_sound
noisy_sound = array_add_noise(sound, ...)
Choose the probability and the noise level
Then you can plot and play:
plt.plot(noisy_sound)
ipd.Audio(noisy_sound, rate=rate)
Scramble the sound!
Check this one out! You can play with the number of splits.
split_sound = np.array_split(sound, 8)
np.random.shuffle(split_sound)
flat_list = [item for sublist in split_sound for item in sublist]
# ipd.Audio(np.array(flat_list), rate=rate)
Combine two different sounds
Let's have fun with these audio clips!
filename1 = "odds.wav"
sr1, data1 = wav.read(filename1)
sound1 = np.array(data1,dtype=float)
#ipd.Audio(data1,rate=sr1)
filename2 = "pass.wav"
sr2, data2 = wav.read(filename2)
sound2 = np.array(data2,dtype=float)
#ipd.Audio(data2,rate=sr2)
data_combined = np.hstack((0.01*sound1,sound2))
print(data1.shape, data2.shape,data_combined.shape)
# plt.plot(data_combined)
# ipd.Audio(data_combined[100000:],rate=(sr1+sr2)/2 )
We had to cheat and modify the magnitude of the first sound, so that we could hear both with similar volume. We also had to modify the rate, here using the average. Can you think of better ways to manipulate these two arrays to get something interesting?