MP 0: Welcome to C, It's Been Waitin' For You
Overview
At this point in your journey as a programmer, I know you are an amazing programmer and have mastered developing small programs! 🎉 In CS 340, you will explore how systems interact with each other and how to build software as part of a larger ecosystem of code.
It is critically important that you have the development environment to support debugging and developing code. In this MP, you will:
- Set up your development and debugging environment for programming MPs in CS 340,
- Interact with open-source C code for encoding and decoding a GIF image,
- Learn how to do interactive debugging by fixing several bugs I made while trying to Illinify a GIF of Taylor,
- Use the CS 340 GitHub for code submission and autograding
MP0 is a preparation MP of the course and is orders of magnitude easier than every other MP in this course. Don’t set your expectations based on this MP. Seriously. :)
Part 1: Initial Setup
Before programming, you’ll need to set up your programming environment and git repository.
-
Follow our guide: “Programming Environment Setup for CS 340”
-
Once you have a
cs340directory, follow our guide: “Setting Up git for CS 340”
Part 2: Fetching the MP0 Starting Code
We have some initial code for your mp0 for you to get started. Use the following command in your cs340/netid directory to merge our initial mp0 directory into your local repository:
git fetch release
git merge release/mp0 --allow-unrelated-histories -m "Merging release repository"
Part 3: Becoming Familiar with Visual Studio Code
Throughout this MP, you will use several features of Visual Studio Code to get comfortable with it!
-
Opening a Project Folder: Most of Visual Studio Code’s project-related features are based on the root of the current folder you have open within Visual Studio Code. Make sure to open the
mp0folder in Visual Studio Code. (You cannot open yourcs340directory, or yournetiddirectory, it must be yourmp0directory.)-
From a terminal, you can run
code .to open up VS Code from that folder. -
Inside of VS Code, you can use File -> Open Folder to open a new folder.
-
-
Opening the Integrated Terminal: The keyboard shortcut
Ctrl + ~will open/close the integrated terminal inside of Visual Studio Code. Using the integrated terminal, let’s verify you are all set up for running C programs by doing the following:- On your terminal, run
maketo compile the provided code. - If you receive any errors, read the error messages. They will often be helpful to describe what’s going wrong. If you’re stuck here, reach out to get help!
- On your terminal, run
-
Running a Visual Debugger: As part of the provided code, we have provided
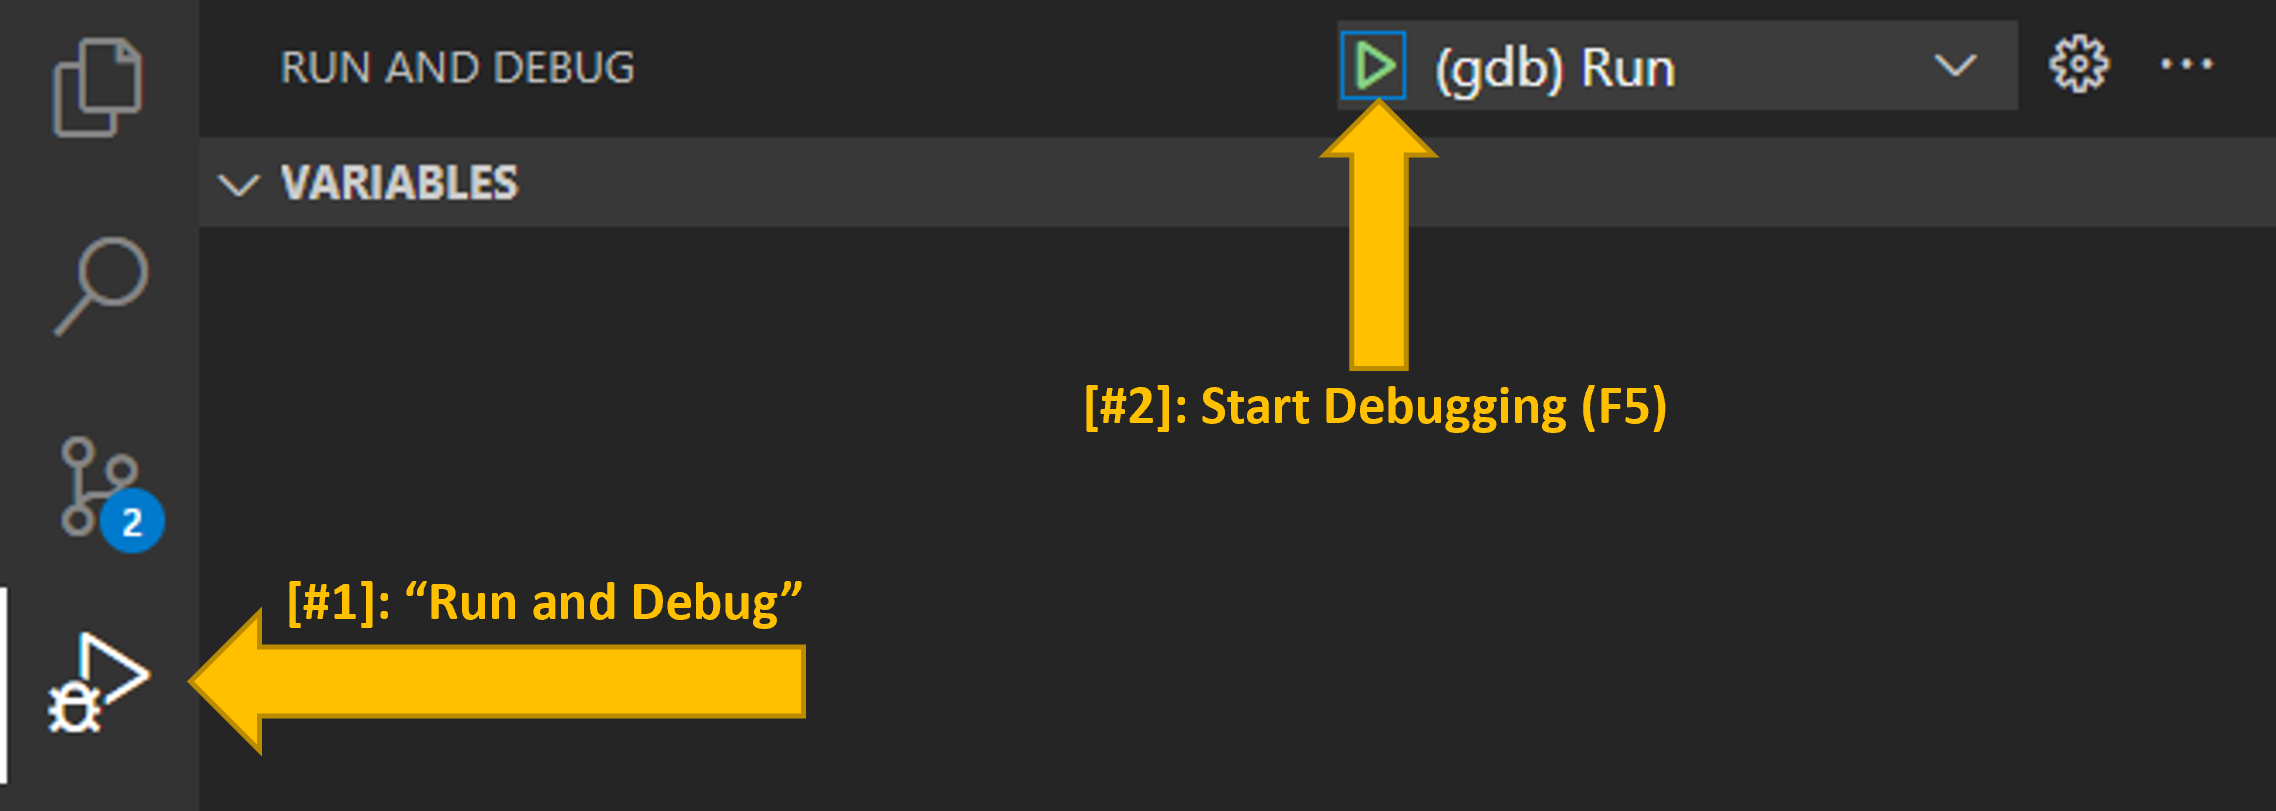
.vscode/launch.json. This configuration file is used by Visual Studio Code to understand the steps needed to “run” your project. It will compile your code usingmakeand then run./maininside of a debugger connected to VS Code. Use Visual Studio Code to “run” your project:- On the left side of Visual Studio Code, find the “Run and Debug” Interface (#1).
- Once on the “Run and Debug” interface, find the green “Debug” arrow to start your program with a visual debugger (#2).
- Press
<Enter>to accepttay.gifas the input file. You’ll use your own gif later. - If the launch of the visual debugger was successful, you will see the program execution pause at the exact moment when the segmentation fault occurred. This may be one of the few times you will ever want a segmentation fault to show up!
Part 4: Debugging the Code
The purpose of this MP is to get comfortable with Visual Studio Code and viewing C code. The gif.c file provided is based off of Marcel Rodrigues’ ultra-small GIF encoding and decoding library, but then modified to allow us to “Illinify” any GIF animation.
Unfortunately, there are several bugs in the code that prevent it from running. You will need to use the Visual Studio Code debugger to help find the bugs.
- Every bug we introduced except for one can be fixed by commenting out a single line of
gif.cto resolve the bug. - The remaining bug requires you make one change to an existing line of code.
To solve these bugs, you will need to follow some common debugging patterns.
Common Debugging Pattern #1: Segmentation Faults
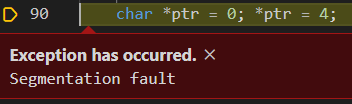
When you run the provided code, you will immediately have a segmentation fault. When using an interactive debugger, you will see the exact position in code when the segmentation fault occurs.
A segmentation fault is an access to a memory address that is not allocated to your process. Often, the line of code where the segmentation fault occurs is valid code. You may need to inspect the code executed in the lines prior to the segmentation fault.
Other errors in the code, like infinite recursion, can cause a segmentation fault when the process runs out of available memory allocated to the process to add a new stack frame.
You will fix several segmentation faults throughout mp0.
Common Debugging Pattern #2: Terminal Messages on Abort
A segmentation fault is only one type of exception that can occur in your code. Other exceptions will provide additional information in stdout or stderr reported on your integrated VS Code terminal.
In this bug you will find that the debugger reports *** stack smashing detected ***:
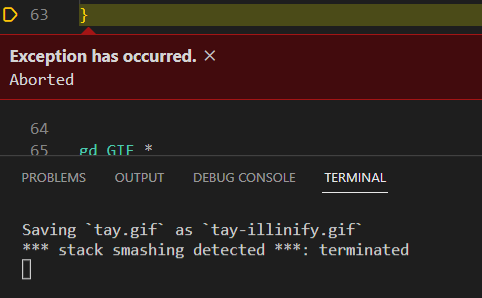
Stack smashing occurs when you write onto stack frame of a function, which is the memory immediately following the local variables to the function. Check the code to find out where we might have written a few too many bytes. (This is the one and only place in mp0 where you don’t comment a line to fix a bug, but modify it.)
You will find additional output in the terminal when finding other bugs throughout mp0.
macOS Specific Information
The default debugger on macOS,lldb, was not able to give a useable stack trace on this stack smashing bug. To fix this bug, figure out the error on Line 61 -- where read is called inside of the read_num function.
Common Debugging Pattern #3: Examining the Call Stack
When your program is paused (due to an exception, you pressing pause, a breakpoint you set, or any other reason), the “Run and Debug” window shows a wealth of useful debugging information.
One panel is labeled “Call Stack”. It will list the function calls that were called leading to where your program is currently paused. You can click on them to jump to their location in code.
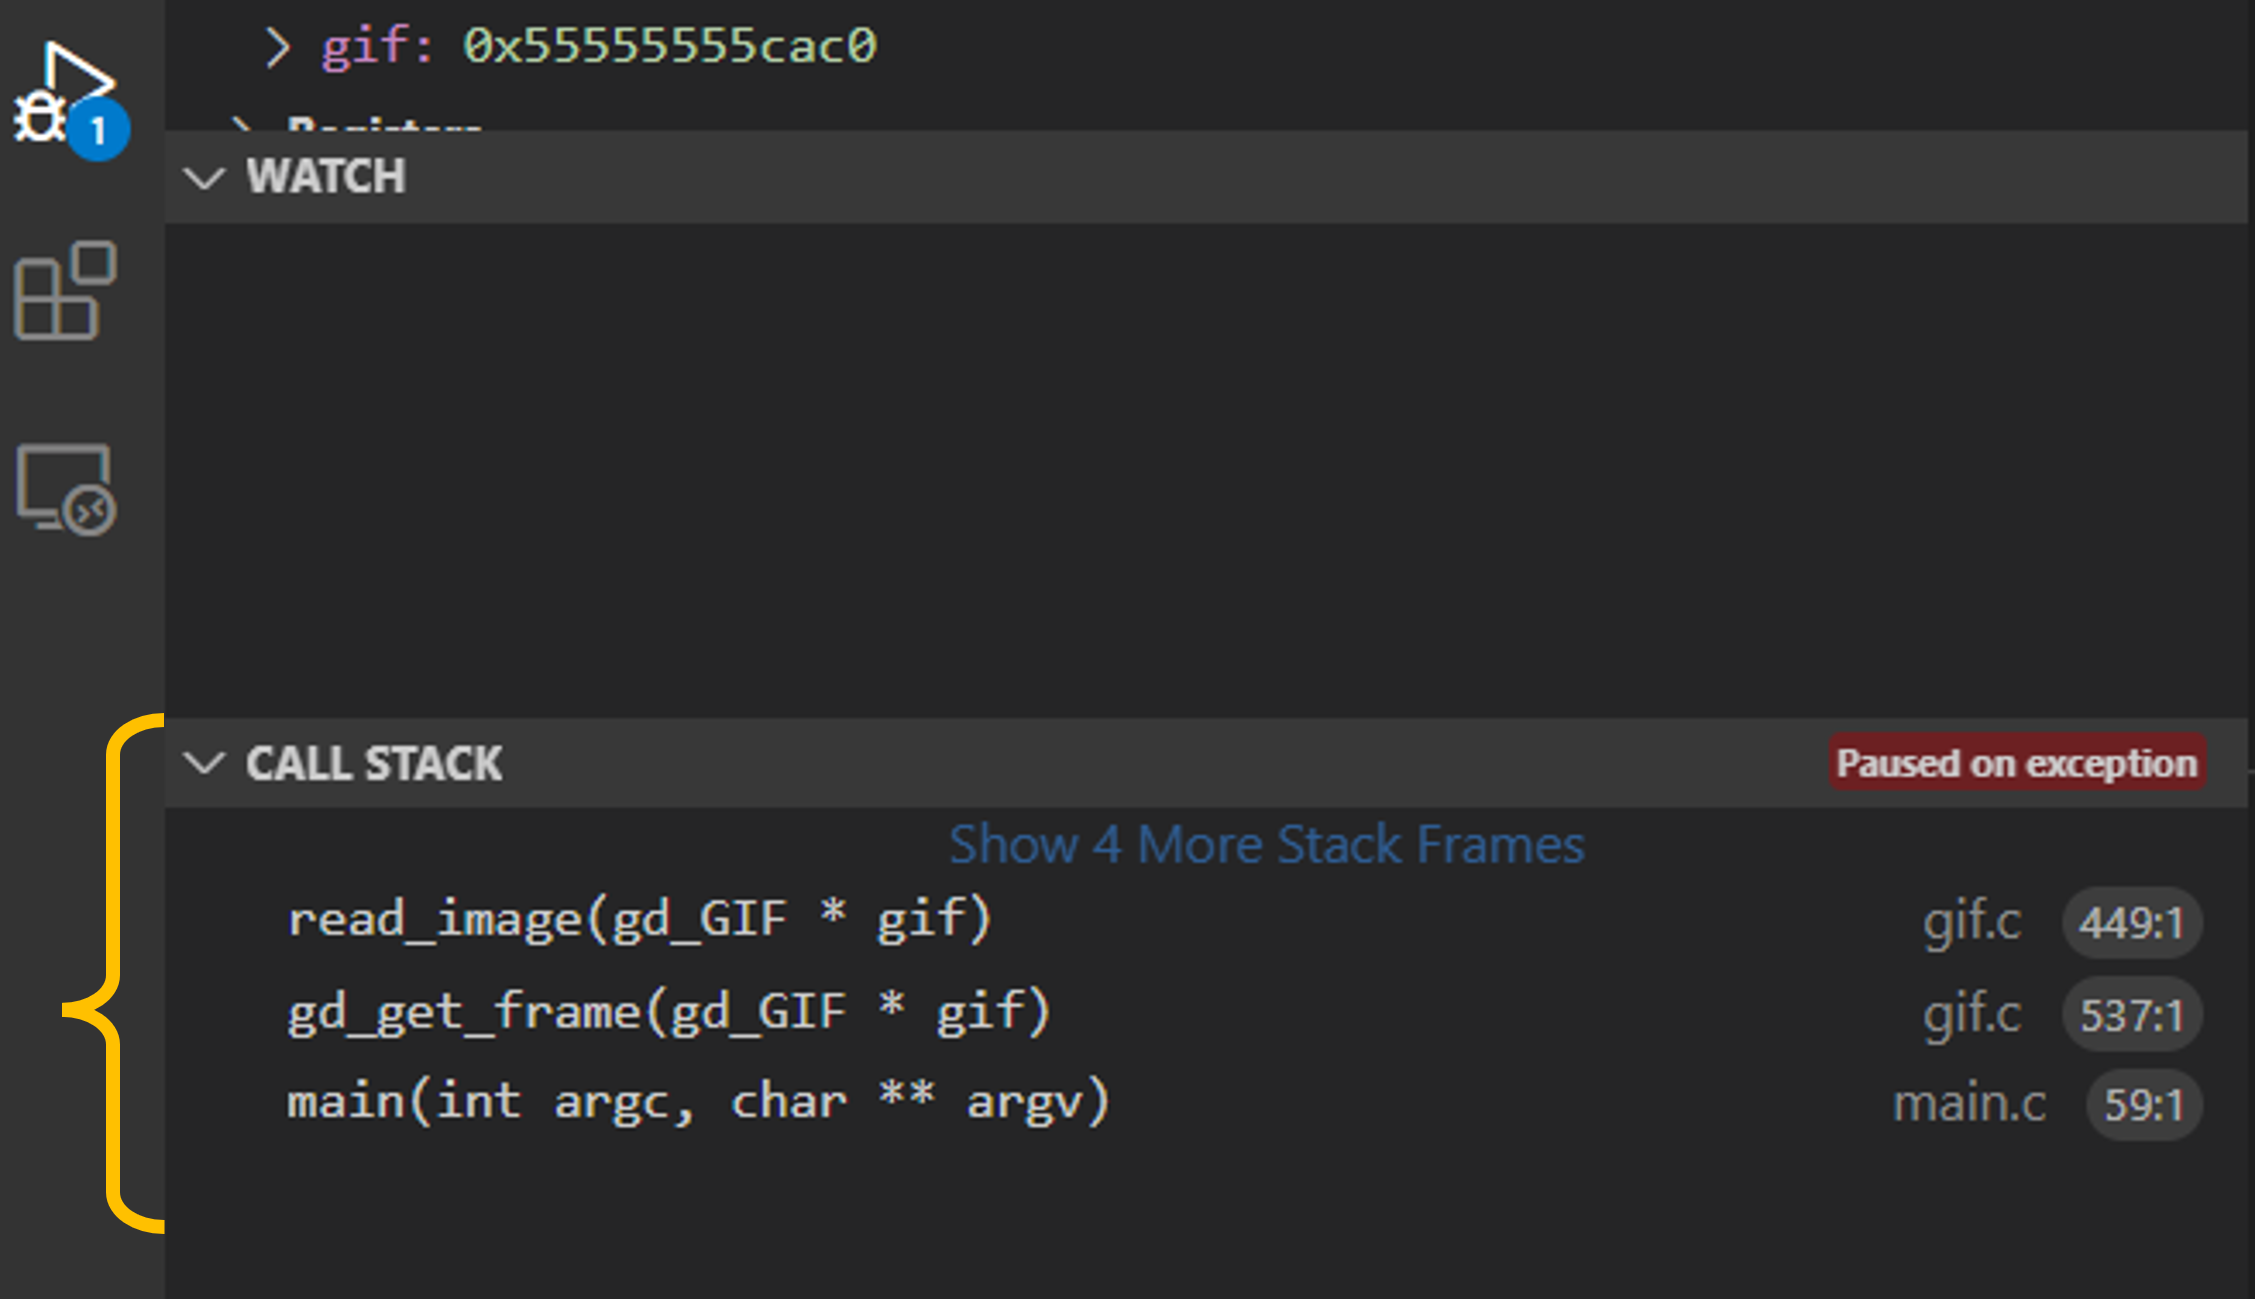
In a call stack, the top is the most recent function called. Specifically, the above call stack shows the read_image function located in gif.c was called and the current line being executed is Line 449. This function was invoked by the function below (gd_get_frame), which itself was invoked by the function below that (main), which is the starting point of this execution.
The call stack is very useful for finding infinite recursion if you see the same function name again and again and again. You will want to reference the call stack for several bugs in mp0.
Common Debugging Pattern #4: Using Pause and Code Stepping
A common programming error is in accidental infinite loop, where no exception occurs but your program is stuck. A common debugging pattern is to pause the execution and examine the code where your program is stuck.
When Visual Studio Code is running your code, you will see the control window:
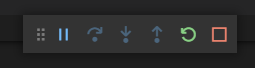
Pressing the left-most “Pause” button will pause the execution of the program and provide you information about the current point of execution. When the program is paused:
- You can hover over variables to see the values their hold,
- You can view the call stack and other debugging information,
- You can use the control window to step through your code line-by-line,
- …and more!
Common Debugging Pattern #5: Setting Breakpoints
Instead of pausing the program manually, programmers will set a breakpoint to have the program automatically pause immediately before running the line of code where the breakpoint is set.
To set a breakpoint, click on the space immediately to the left of the line number. A bright red dot will appear to indicate that an active breakpoint is set:
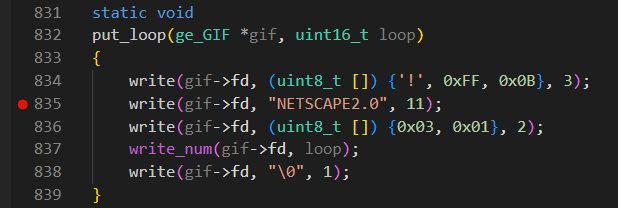
In the example above, execution will pause after running Line 834 but before running Line 835. Since it’s paused, you can inspect all of the variables at the exact moment before running Line 835. If you resume the program and the breakpoint is encountered again, it will pause again.
Part 5: Discovering a Hidden Message
Once you have all the bugs debugged, the program will complete and process all of the GIF frames and produce tay-illinify.png – you have just done an Illinify transformation of a Taylor Swift GIF!

tay.gif
tay-illinify.gifNope.
That’s not enough Illini.
Did it even work?
Final Fix: A Hidden Message
As your final debugging task, I hid a message for you in the source code. Use your knowledge of Visual Studio Code debugging, find the value stored inside of the global variable message at any time after the _illinify function is called. (Hint: Set a breakpoint; I purposefully made sure the message would not show up if you just use printf.)
Follow the instructions stored in the variable message I hid for you, run the program, and check out how tay-illinify.gif looks now!
Part 6: Course Discord
The primary CS 340 virtual space is the CS 340 Discord server. I want to see your favorite GIF, and make sure you’re all set up with Discord so you can be part of the CS 340 community.
- If you have not already, join the CS 340 Discord. Change your nickname on the CS 340 server to something where we know who you are on Discord (either your first name, your NetID, something) or DM
wafto privately share your username/identity association so we can give you points. - Illinify a GIF of something special to you (yourself, a celebrity, Genshin Impact, whatever).
- Post your transformed GIF to the
#mp0-gifsDiscord channel.
Submission and Grading
Testing Suite
When you are finished working on the MP, you can run a local copy of the same test suite that you will use for grading. To run the test suite:
- To compile the test suite, run
make test. - To run your code, run
./testand everything should pass! 🎉
Submission
Once you have locally passed all the tests, you will need to submit and grade your code. First commit using the standard git commands:
git add -A
git commit -m "MP submission"
git push
Grading
The initial grading is done via a manual GitHub Action. You MUST complete this step before the deadline to earn any points for the MP:
- Navigate to your repository on https://github.com/cs340-illinois.
- Click on the “Action” Tab
- Choose “mp0 autograding”
- Click the green “Run Workflow” button (located on the blue bar)
- Press “Run Workflow”
- You will trigger a GitHub Action that will complete the grading run!
Points
The 40 points for this MP are split in the following way:
| Description | Points |
|---|---|
| Test Suite | 30 |
| Discord | 10 |