MP0
IDE and Debugger
Due dates may be found on the schedule.

This is not a full MP; it is primarily testing your setup and ensuring you are ready for subsequent MPs. It is dramatically easier than other MPs. Don’t plan your time on other MPs based on this one.

The purposes of this MP are:

  1. Ensure you are set up to do other C-language MPs in this course.
  2. Have you see some of the tools the VS Code debugger can do.

Is it possible to create the required gif.c without doing this two things? Yes. Should you do that? No.

1 Set up your environment

Follow the directions on the MP environment setup page. We’ll only use the local toolchain in this MP.

2 Fetch starter code

We have some initial code for your mp0 for you to get started. Download it from mp0.zip and unzip it on your computer into the cs340 directory you created during the environment setup.

3 Use Visual Studio Code

Visual Studio Code (more often called VS Code) is an Integrated Development Environment (IDE)1 Integrating such potentially-independent tools as a code editor, multi-file build manager, debugger, and documentation browser. with many features shared with other IDEs. Learning to use it well will help you feel comfortable in other IDEs you may use in the future.

Projects

IDEs have the notion of projects, which contain a set of files related to a single task or program. Typically, these reside in a folder and all of its subfolders. In this class, each MP will be its own project, meaning you need to open VS Code in mp0 or mp1 or the like, not in some parent folder that contains them all.

A folder that is set up to be a VS Code project will have inside of it a folder named .vscode. In many systems files and folders with names that start with a . are hidden from view.

To open the mp0 folder in VS Code, do one of the following:

  • From a terminal, cd into the mp0 folder and run code .

  • Inside of VS Code, use File → Open Folder to open a new folder.

Integrated Terminal

IDEs give access to the terminal, but often add configuration so that it’s got everything needed to build the project ready to use. To open VS Code’s integrated terminal, use the keyboard shortcut Ctrl+~.

Using the integrated terminal, let’s verify you are all set up for running C programs by doing the following:

  • On your terminal, run make to compile the provided code.
  • If you receive any errors, read the error messages. They will often be helpful to describe what’s going wrong. If you’re stuck here, reach out to get help!
Visual Debugger

IDEs provide a user interface over the normal debugger tools for your language. In VS Code, the debugger tool to use and how to attach it to the visual debugger is defined in .vscode/launch.json. Designing these configuration files is not a goal of this course, so we provide them for each MP.

Our launch.json files for C programs use Makefiles, one of the oldest and best-established command-line build management tools. You can compile your code from the command line by typing make and run any tests we provided by typing make test. The launch.json will do these two commands but attach a debugger to the running code, and may also have other commands for handling specific cases in some MPs.

You can run VS Code’s debugger in two ways:

  • On the left side of Visual Studio Code, find the Run and Debug Interface (#1).
  • Once on the Run and Debug interface, find the green Debug arrow to start your program with a visual debugger (#2).
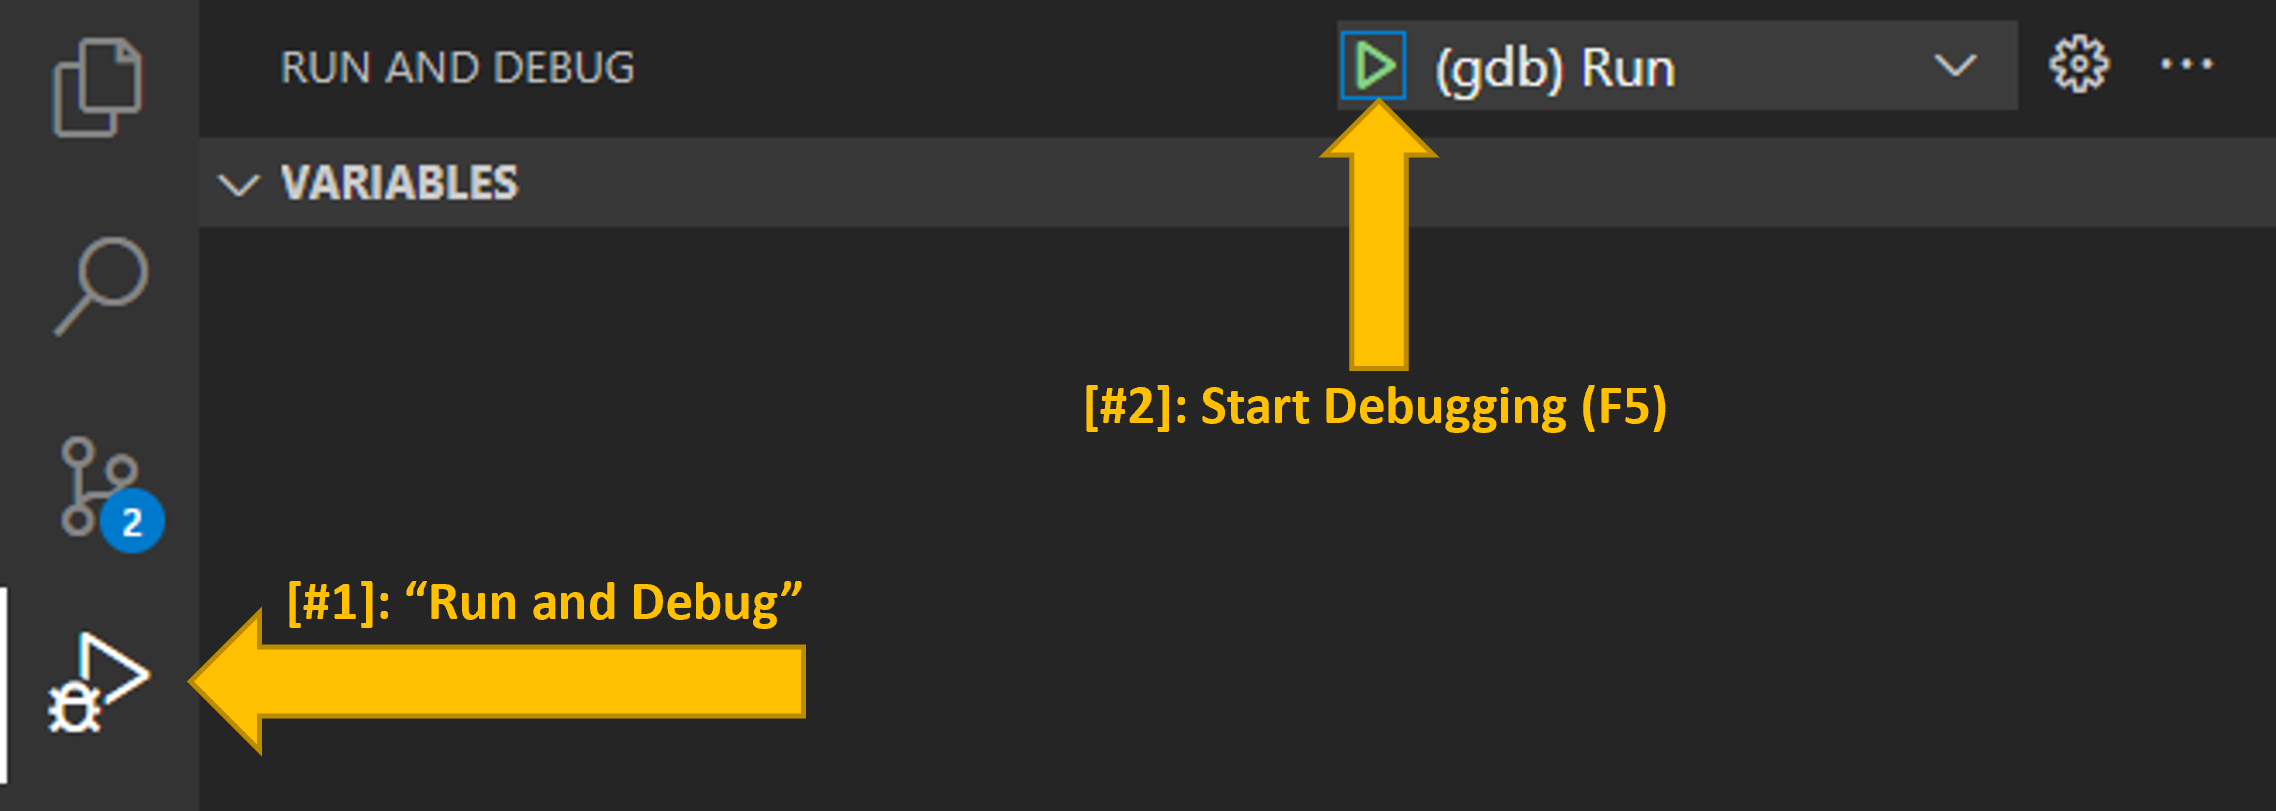
Location of debug buttons in default VSCode intrface

Depending on the project, it may ask you to pick a launch configuration to run and may ask for per-run configuration.

For MP0, start by accepting the defaults when you run the debugger. After a moment the debugger will pause execution because of a segmentation fault.

Example segfault error notification
Configuration problems and solutions

This is a collected set of configuration problems that some students have faced, and how they solved them.

All

Make sure you’ve opened the right folder. The first line in VS Code’s explorer should be

MP0 [DEV CONTAINER: EXISTING DOCKERFILE]

If it is something other than MP0, use File → Open Folder to open the mp0 directory.

If it does not say DEV CONTAINER, use the remote icon to reopen in container.

See our environment page for more.

No such file gif error message

When running, pick (gdb) Run, not C/C++: gcc build and debug active file.

(gdb) Run is the setup we provide in this MP with our Makefile that assembles the program from several files.

C/C++: gcc build and debug active file is a built-in default in VS Code that doesn’t understand that a program can include several files.
4 Debug the Code

To help you learn how to use the debugger, we provide a version of gif.c by Marcel Rodrigues that has multiple bugs inserted. Each bug is designed to help you see the value of a different aspect of the debugger.

Each bug can be fixed by editing a single line of code: all but one by commenting out a line and the last by making one change to a line. That’s obviously not true of must real bugs: they tend to span many lines and even many files. Our goal in this MP is not to show you what real bugs look like, it’s to show you what the debugger can do.

Segmentation fault

A segmentation fault occurs when code tries to deference a pointer to memory that is not in use. Memory references occur with the *address, address->, and address[offset] operators. Debuggers are very good at locating segmentation faults, but the bug that caused the fault is often in an earlier line that computed the address (or failed to do so).

MP0 has several segmentation faults.

Stack Smashing

Stack smashing occurs when code tries to change memory that belongs to a different function’s activation record2 also called a stack frame or local address space.

Recall that each function is given a region of memory on the call stack, called an activation record, in which to store its arguments and local variables. The function that called the current function’s activation record is right after the current activation record in memory. In between these two the compiler inserts special guards to make sure memory accesses don’t cross the boundary: if they do, that’s stack smashing.

Stack smashing is one of several bugs that will have information printed to the terminal, not just alerted in the debugger.

MP0 has only one stack smashing error.

Call Stack Inspection

When the debugger pauses, either on an error or because you added a breakpoint, the Run and Debug window shows a wealth of useful debugging information.

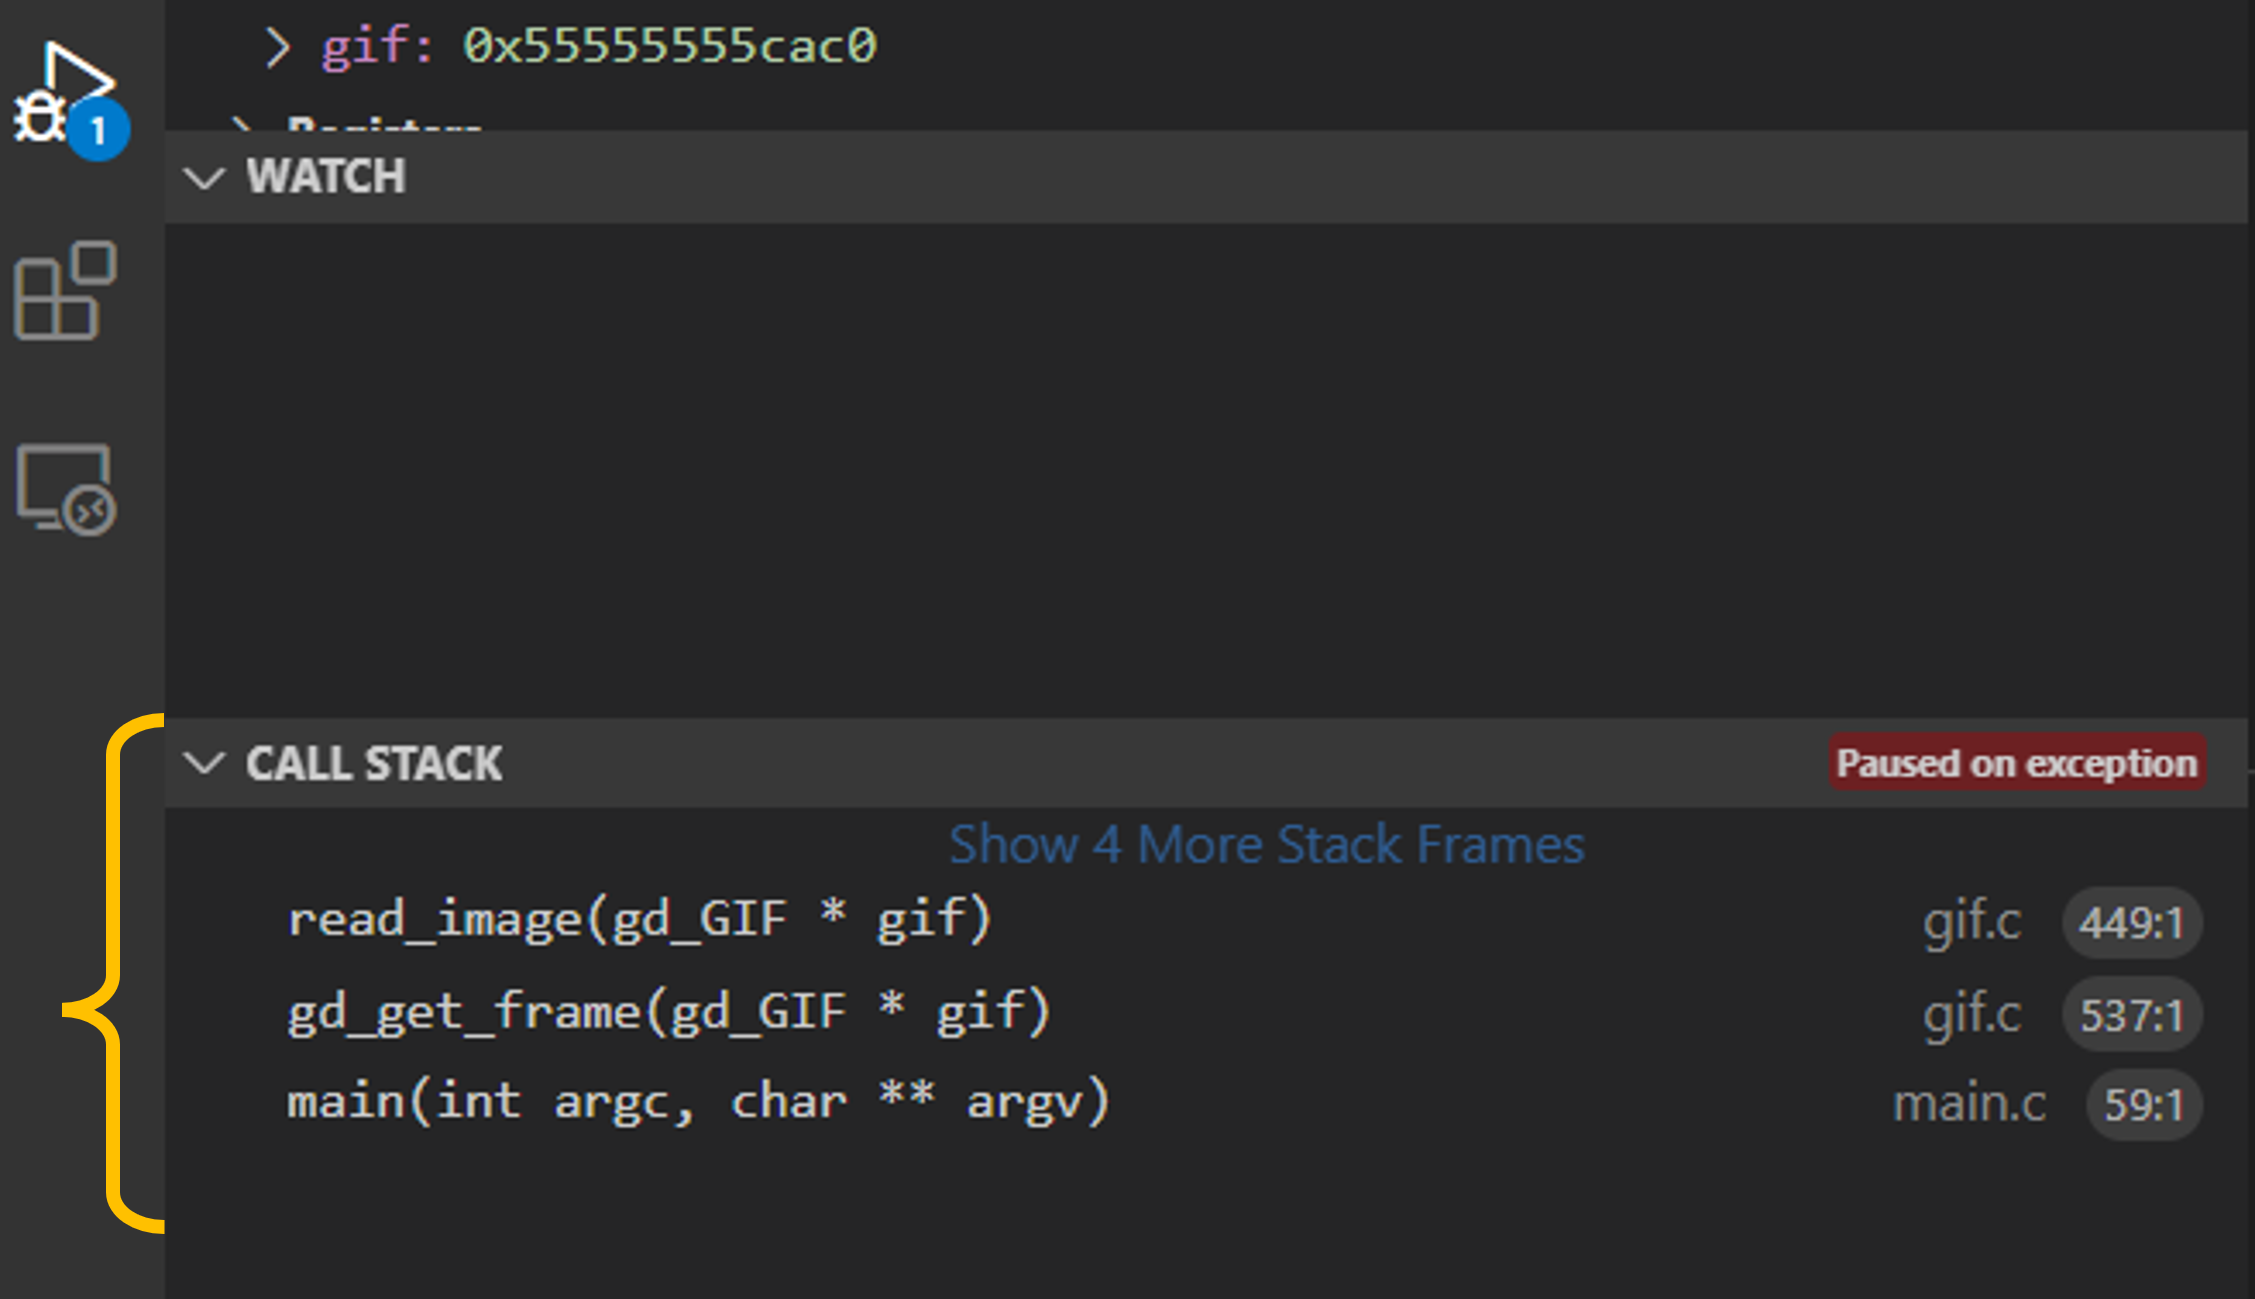
One panel is labeled Call Stack. It will list the function calls that were called leading to where your program is currently paused. You can click on them to jump to their location in code.

Example call stack

In a call stack, the top is the most recent function called. Specifically, the above call stack shows the read_image function located in gif.c was called and the current line being executed is Line 449. This function was invoked by the function below (gd_get_frame), which itself was invoked by the function below that (main), which is the starting point of this execution.

The call stack is very useful for finding infinite recursion if you see the same function name again and again and again. You will want to reference the call stack for several bugs in mp0.

Pause-and-step

If there’s an inffinite loop, the program will appear to make no progress. In that case, you can pause the debugger and step3 When on a function call, there’s a difference between stepping over the function (i.e. skip forward until it has a return value) or into the function (i.e. skip forward to its first instruction). through the code to see what is happening.

Pause button and other debugged execution controls

Pressing the left-most Pause button will pause the execution of the program and provide you information about the current point of execution. When the program is paused:

  • You can hover over variables to see the values their hold,
  • You can view the call stack and other debugging information,
  • You can use the control window to step through your code line-by-line,
  • …and more!
Breakpoints

When a program is doing the wrong thing, the most common approach to debug is to set breakpoint. This means picking a line of code and telling the debugger to pause when it reaches that line (before it runs it).

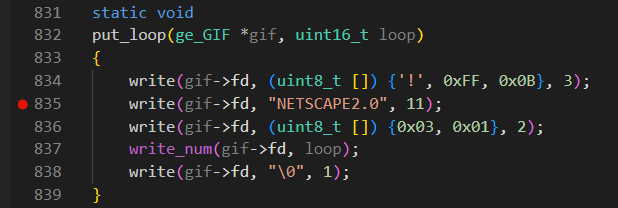
To set a breakpoint, click on the space immediately to the left of the line number. A bright red dot will appear to indicate that an active breakpoint is set:

Marker indicating a break point set on line 835

In the example above, execution will pause after running Line 834 but before running Line 835. Since it’s paused, you can inspect all of the variables at the exact moment before running Line 835. If you resume the program and the breakpoint is encountered again, it will pause again.

If you’ve done print-based debugging before, that’s a sloppy way of trying to approximate a breakpoint + hovering over variables without using a debugger. Print-based debugging is like crawling because there’s no room to stand. If you have access to a debugger but are still using prints, you’re wasting time and energy and also look foolish to more experienced programmers.

Watches and Beyond

Sometimes a variable changes many times, with the information you need to debug it appearing and then disappearing later. There are multiple debugging tools for these situations, which can get quite involved; two of the simpler such tools are watches and conditional breakpoints.

In MP0 we have one bug that could benefit from these tools, though it could also be debugged with a breakpoint and stepping if you are patient. After you’ve fixed all the obvious bugs the code will run but it won’t do very much. In particular, if you run it with the default argument ./main tay.gif4 Wade Fagen-Ulmschneider, who created this assignment, is a huge fan of Taylor Swift and of Illini Orange. We retain that image in this MP in recognition of his design of this assignment. it will create tay-illinify.png which will be just slightly redder than tay.gif, not the bright orange the program is supposed to add to images.

There’s still another bug: logic error in the resulting behavior, one of the hardest kinds of bugs to find because nothing crashes. To help you find it, there’s a secret message explaining how to fix it inside the global message variable, but that message is only there part-way through a run of the program. Find the message and make the final fix to complete the MP and make a program that turns GIFs noticeably orange.

5 Submission and Grading

Only edit gif.c, none of the other files we provide. gif.c is the only file you can upload so if you change anything else your code won’t work the same for you as it does for us.

When you think you are done, make test will run all our tests and report what grade we think you’ve earned.

Once you’ve passed all the tests, submit your code on the upload site.

This MP has very low weight, all-or-nothing grading, and accepts late submissions at no grade penalty.

The final line of output from make test will be SCORE: 0 / 1 or SCORE: 1 / 1: this tells you how much credit you’ll get if you submit this code. Some later MPs will also have a SCORE MULTIPLIER: 0.75 or the like that might reduce your score if there are nonfunctional requirements tested by valgrind, use of specific functions, or the like, but MP0 does not have a multiplier.

You may submit as often as you like, including replacing old submissions. This is true of all MPs. Only your last submission will be included in your grade.