Learning Objectives
- Introduce you to the format and structure of coding assignments in CS 277
- Learn and practice the fundamentals of the Markdown language (for text writing).
- Learn and practice the fundamentals of coding and running Python cells in the notebook format.
- Determine how to meaningfully and accurately describe 2D coordinate graphs
- Construct and hard-coded shape graphs to specific file locations in Matplotlib
Assignment Description
Modern data science revolves around programming – creating sets of instructions that when read by a computer will produce the desired outcome. This lab contains foundational exercises for two important concepts: how to write code and how to think about a computational problem.
The first part of the lab is an introduction to the Python Notebook framework which can be completed as an individual or alongside the rest of the class. The second half of the lab is meant to be completed with a partner although all code should be written and submitted indepdently. However the most important skill for is not how to code but how to think about and identify a solution to a problem.
This lab will also serve as a brief introduction to Matplotlib. Matplotlib is one of the most useful visualization tools in Python for all kinds of data explorations and analyses. We will return it to it many times throughout the semester to build different kinds of images. However here we will start with a very simple subset of the package: matplotlib.patches
Submission Instructions
WARNING: To accommodate students enrolling in the class late, this lab has a longer deadline than every other assignment in the class! A standard lab is due the following Thursday!
Using the Prairielearn workspace, test and save your solution to the following exercises. (You are welcome to download and work on the files locally but they must be re-uploaded or copied over to the workspace for submission).
You will only need to modify the following files:
notebook_intro.ipynblab_patches.ipynb
Part 1: An Introduction to Python Notebooks
The accompanying Python notebook (on PrairieLearn) will walk you through how to read, run, and modify a Python notebook. To demonstrate you have completed this part of the lab, you will need to find the ‘hidden’ function in the notebook and update it to return the correct answer to Life, The Universe, and Everything.
If you are reading this while working on the lab itself, please note that the material on these webpages usually offer supplemental material rather than a direct repeat of content found in the assignment itself. For most labs, the web writeup will simply list out the functions you need to complete and (when relevant) give an example. So for Part 1…
answerMe()
# Input:
# None
# Output:
# The function should return the number 42
int answerMe():
A brief descrption is usually sufficient when combined with the specific Input / Output though if you have any questions, you are strongly encouraged to bring them up to any course staff member! In this case, the function takes nothing as input and should always return 42.
Hint: If you are unfamiliar with functions, dont worry! We will cover them in class. For now, consider what the ‘return’ line in the provided code is doing and try to modify it to return the correct answer.
Part 2: Precision Pictures with Plaintext
Once you have completed the first notebook and passed the autograder, you will be given a randomly generated PNG containing a series of shapes of different colors and positions. Don’t show this picture to other students, its your unique picture!
This may seem silly now, but the most important skill in learning to program is not actually programming but how to think about a computational problem. There is a reason why every function you are asked to write in this class will have a clear “Input” and “Output”! For now, lets put your critical thinking skills to the test by writing out a step-by-step list of instructions for how you would recreate the image you have.
Once you are done, wait patiently for part 3!
Part 3: The Big Picture (of Programming Pictures)
Matplotlib is an important Python library that supports a wide range of visualizations and integrates with many data science libraries such as NumPy, Pandas, scikit-learn, and many more. The lab lecture will go over how to use a specific package in this space (matplotlib.patches) through worked examples. Follow along in the provided notebook and complete the following five exercises at your own leisure:
doubleSquare()
# Input:
# None
# Output:
# Creates and saves a .PNG with the required image
None doubleSquare():
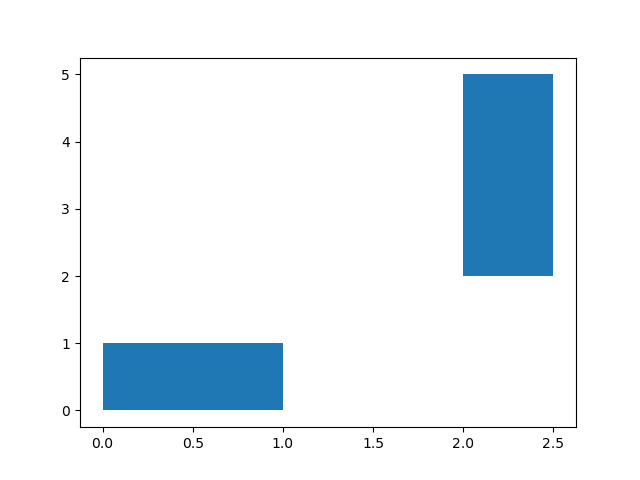
Create a PNG plot with the filename doubleSquare.png which contains two Rectangles with the following specification:
- Rectangle 1 starts at position (0, 0) and is a square where all sides have size 1
- Rectangle 2 starts at position (2, 2) and has width 0.5 and height 3
If you’ve implemented this correctly, you should see the following:
tripleTriangle()
# Input:
# None
# Output:
# Creates and saves a .PNG with the required image
None tripleTriangle():
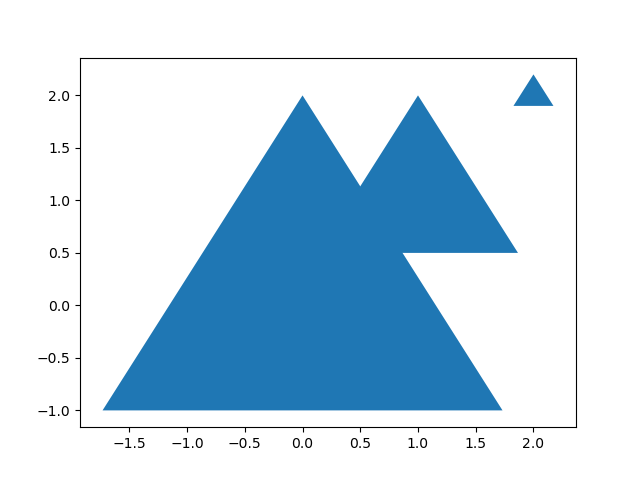
Create a PNG plot with the filename tripleTriangle.png which contains three Triangles (RegularPolygons with 3 vertices) with the following specifications:
- Triangle 1 starts at position (0, 0) and has a radius of 2
- Triangle 2 starts at position (1, 1) and has a radius of 1
- Triangle 3 starts at position (2, 2) and has a radius of 0.2
Consider: Does the order you plot matter here? Why or why not?
If you’ve implemented this correctly, you should see the following:
triColor_tripleTriangle()
# Input:
# None
# Output:
# Creates and saves a .PNG with the required image
None triColor_tripleTriangle():
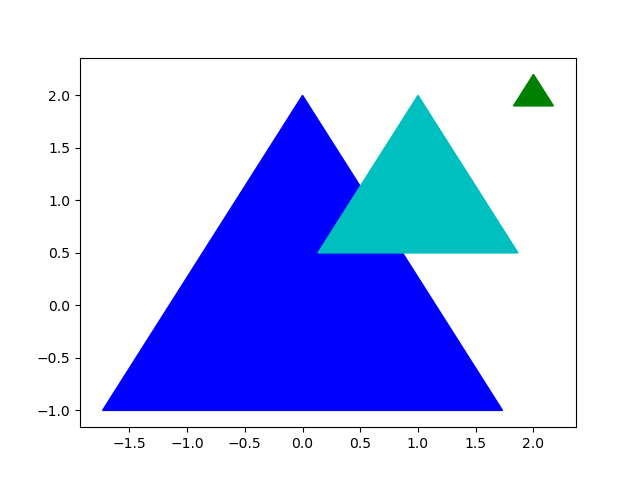
The image should be the same shape as tripleTriangle except with the following additions:
- The first triangle at position (0,0) should be blue.
- The second triangle at position (1, 1) should be cyan.
- The third triangle at position (2, 2) should be green.
Consider: Does the order you plot matter here? Why or why not?
If you’ve implemented this correctly, you should see the following:
squareCircle()
# Input:
# None
# Output:
# Creates and saves a .PNG with the required image
None squareCircle():
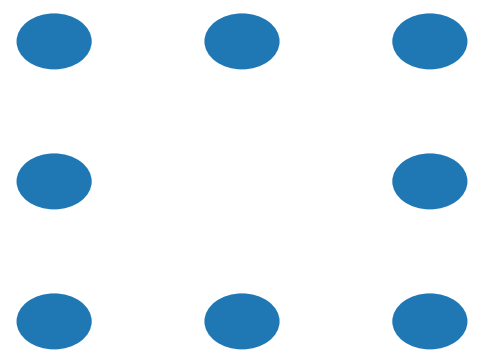
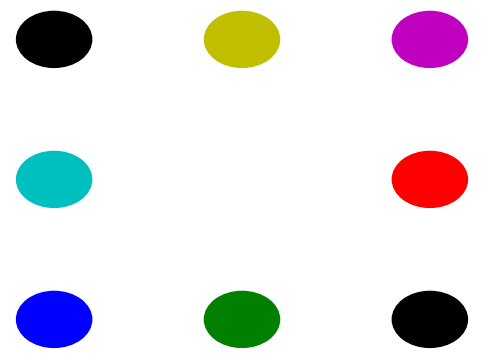
You must draw eight circles, each of which have a radius of 0.2. The circles need to be positioned to form a square where every ‘side’ of the square consists of three circles equally spaced from each other.
To get you started, the vertex endpoints of your square would be:
- A circle centered at (0, 0)
- A circle centered at (2, 0)
- A circle centered at (0, 2)
- A circle centered at (2, 2)
If you’ve implemented this correctly, you should see the following (although I’ve cropped the axes to not give away the full answer):
rainbow_squareCircle()
# Input:
# None
# Output:
# Creates and saves a .PNG with the required image
None rainbow_squareCircle():
The image should be the same shape as squareCircle except from left to right, top to bottom the colors should be:
Black, Yellow, Magenta, Cyan, Red, Blue, Green, Black
If you’ve implemented this correctly, you should see the following (also cropped the axes to not give away the full answer):
Part 4: Partner Picture Practice
Towards the end of the lab section, you will be asked to partner up with another individual to share the description you wrote in Part 2. Don’t cheat and modify it just yet!
Given your partners description, use what you’ve learned in the lab to try to recreate their image from scratch. Then compare your output image with their original. Time permitting, repeat this exercise with the second randomly generated picture set but be warned the second generation is a little harder!