Visual Debugger in VS Code
In CS 240, we highly recommend setting up a visual debugger for the MPs. While the command line version of the debugger is equally useful, its interface can sometimes be quite difficult to navigate. There are a lot of tools out there to help make the debugging process a little easier for you. For example, VS Code provides a visual debugger interface with some great features.
In this guide, we will help you quickly set up the visual debugger in VS Code and introduce you to its interface. For more detailed inforamtion on the various debugging features, please check out the official documentation from VS Code.
Debugging C
In this section, we will go over how to set up and use the debugger for the C MPs.
Setup
VS Code has built-in debugging support for languages like Javascript. To extend VS Code to support debugging C programs:
- Launch VS Code. Note that if you are on Windows, you need to launch VS Code from WSL
- Install the C/C++ extension
How to Use
In the MP starter files, we have included custom configuration files (launch.json and tasks.json inside the .vscode folder) which will allow you to run your program and test with the debugger. Note that for VS Code to find and use our configuration settings, you need to open the MP folder as the root folder.
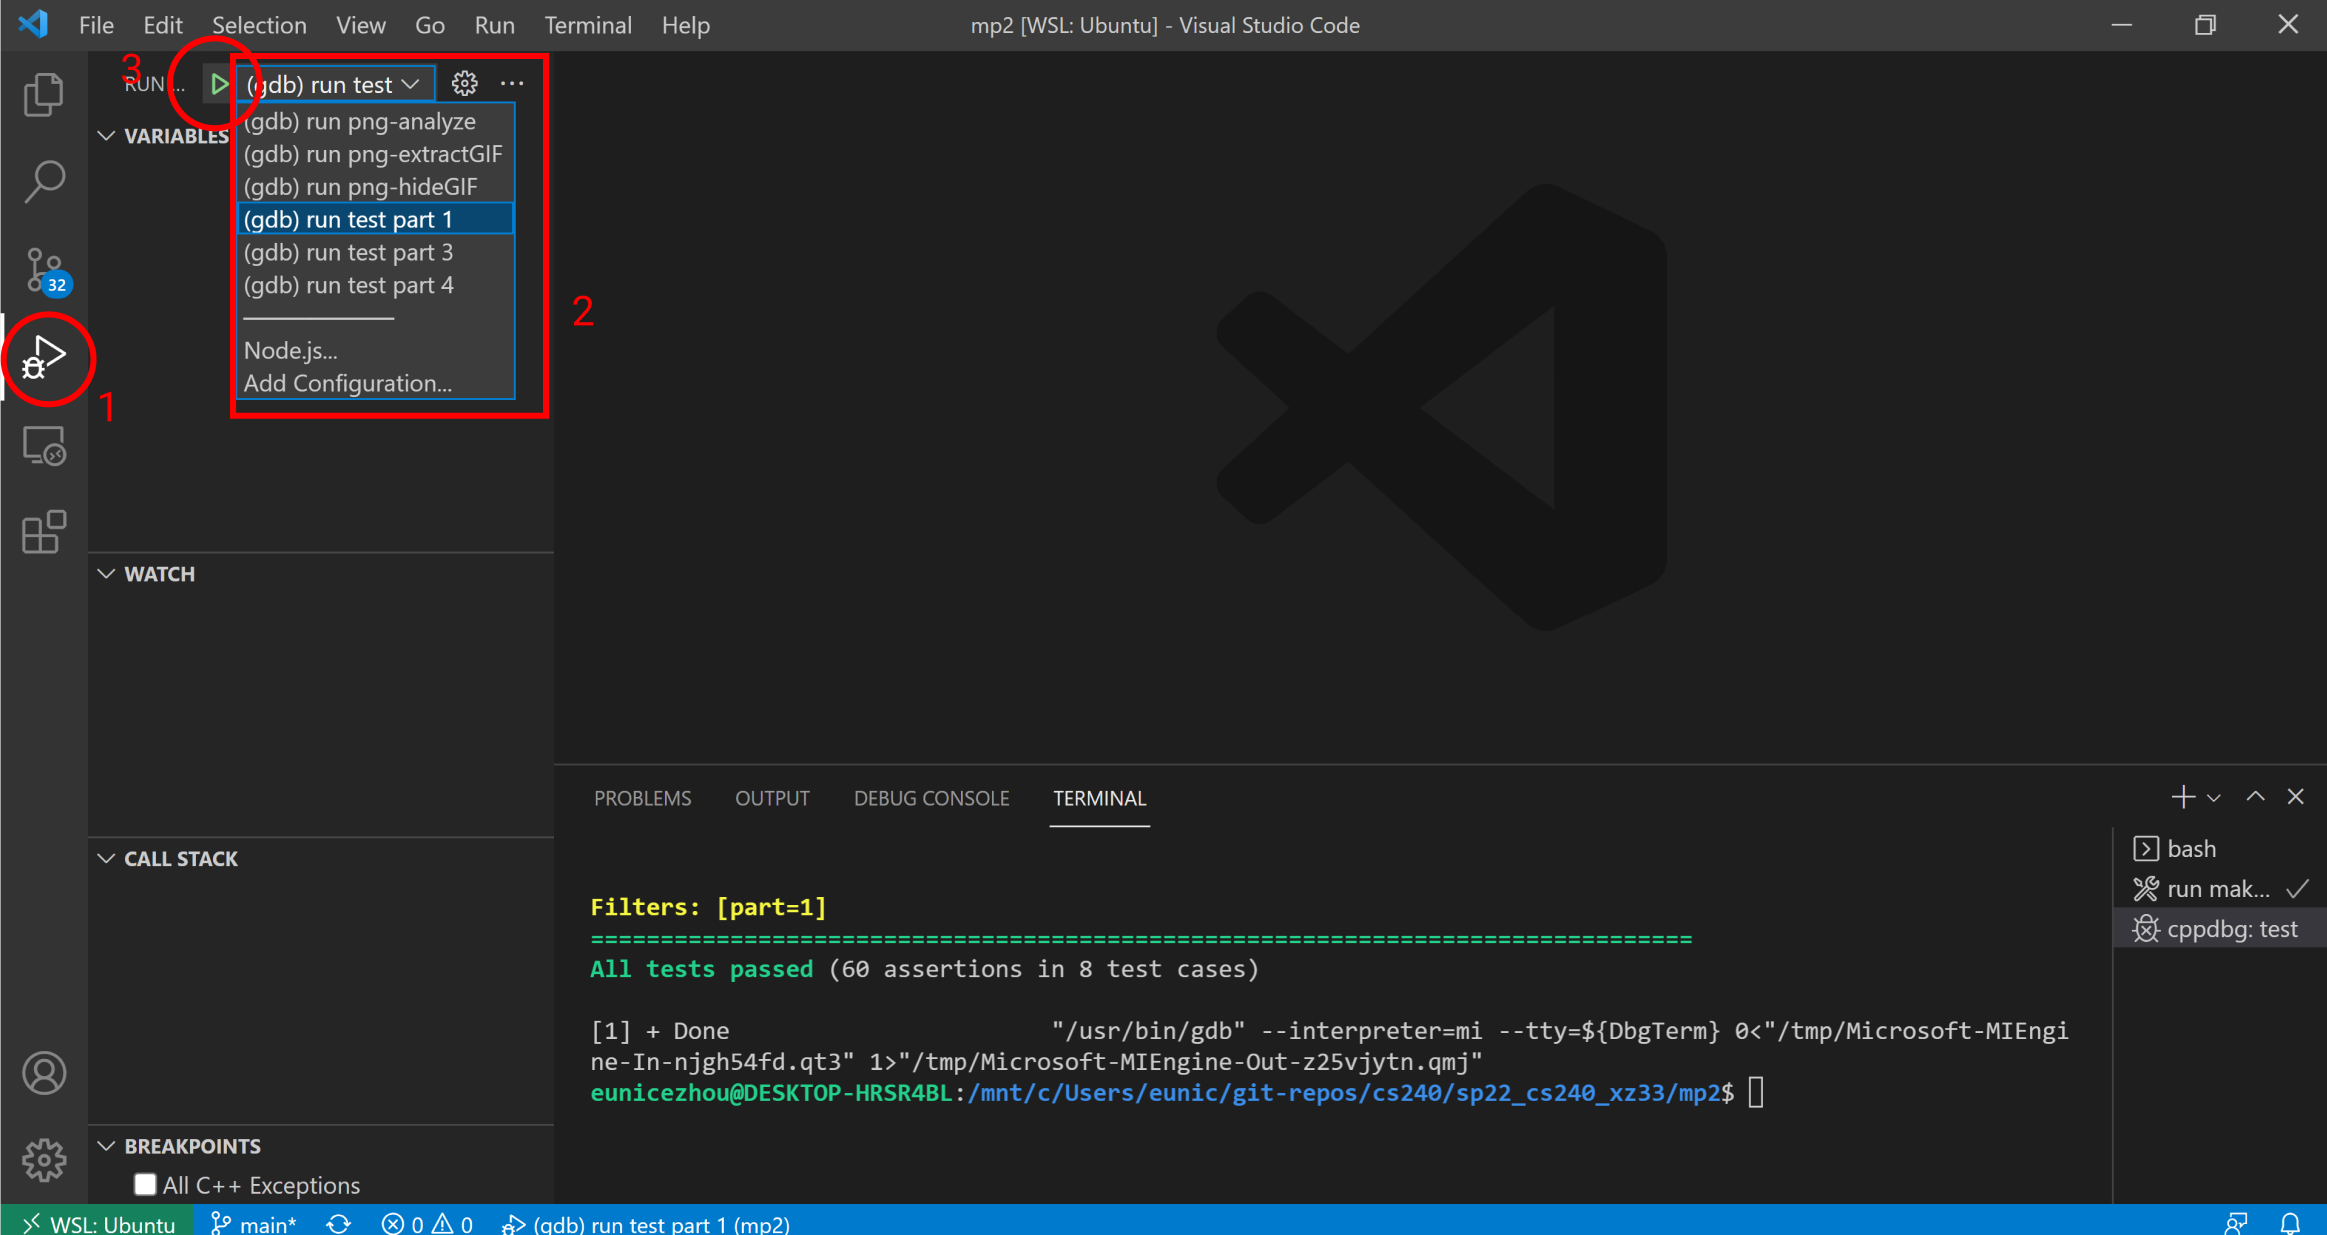
To launch the debugger:
- Navigate to Run and Debug tab in the left panel
- Click on the dropdown to select the executable to run
- Start debugging by clicking on the green play button
Debugging Python
In this section, we will go over how to set up and use the debugger for the Python MPs.
Setup
To extend VS Code to support debugging Python programs:
- Launch VS Code. Note that if you are on Windows, you may or may not need to launch VS Code from WSL depending on the test cases you want to run
- Install the Python extension
- If you haven’t already, you should also
pip install pytest, which is the testing framework we will use for the Python MPs
Configure
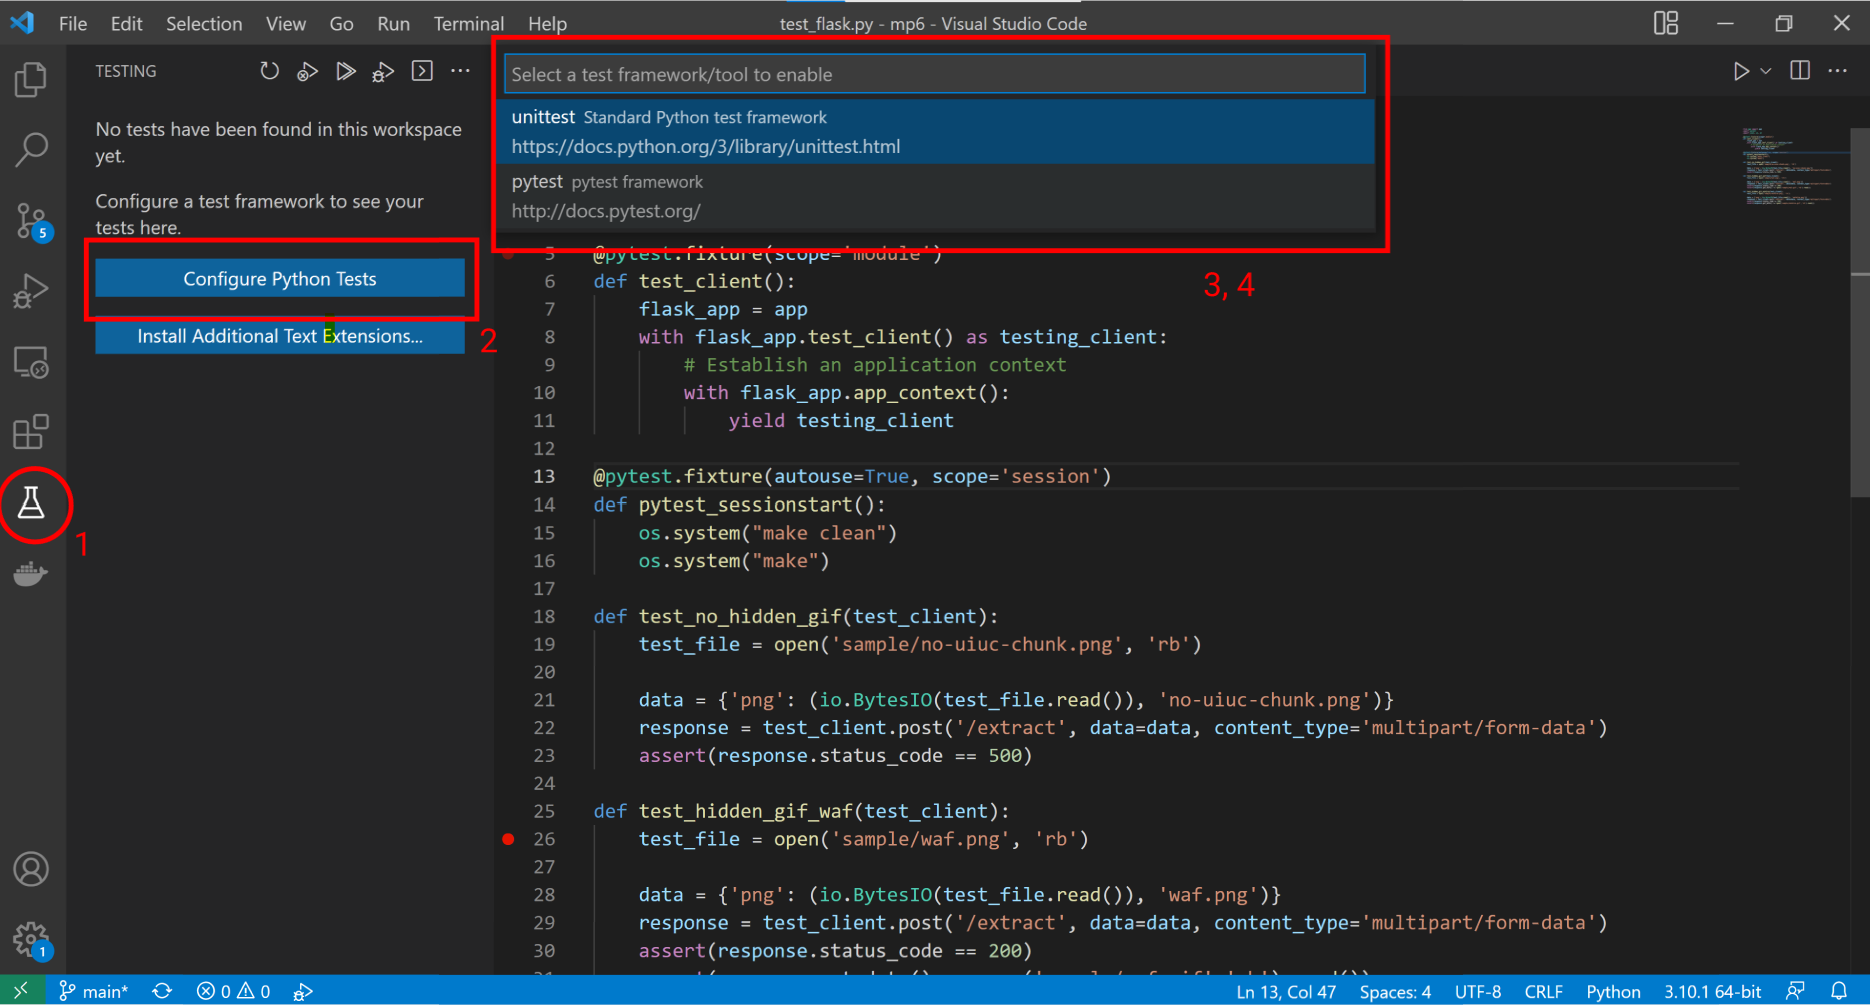
Once you have the Python extension installed and your MP open in the editor, you will configure the test by doing the following:
- Navigate to Testing tab from the VS Code Activity bar (left sidebar)
- Click Configure Python Tests
- When prompted, select pytest as the testing framework
- Select the directory containing the tests
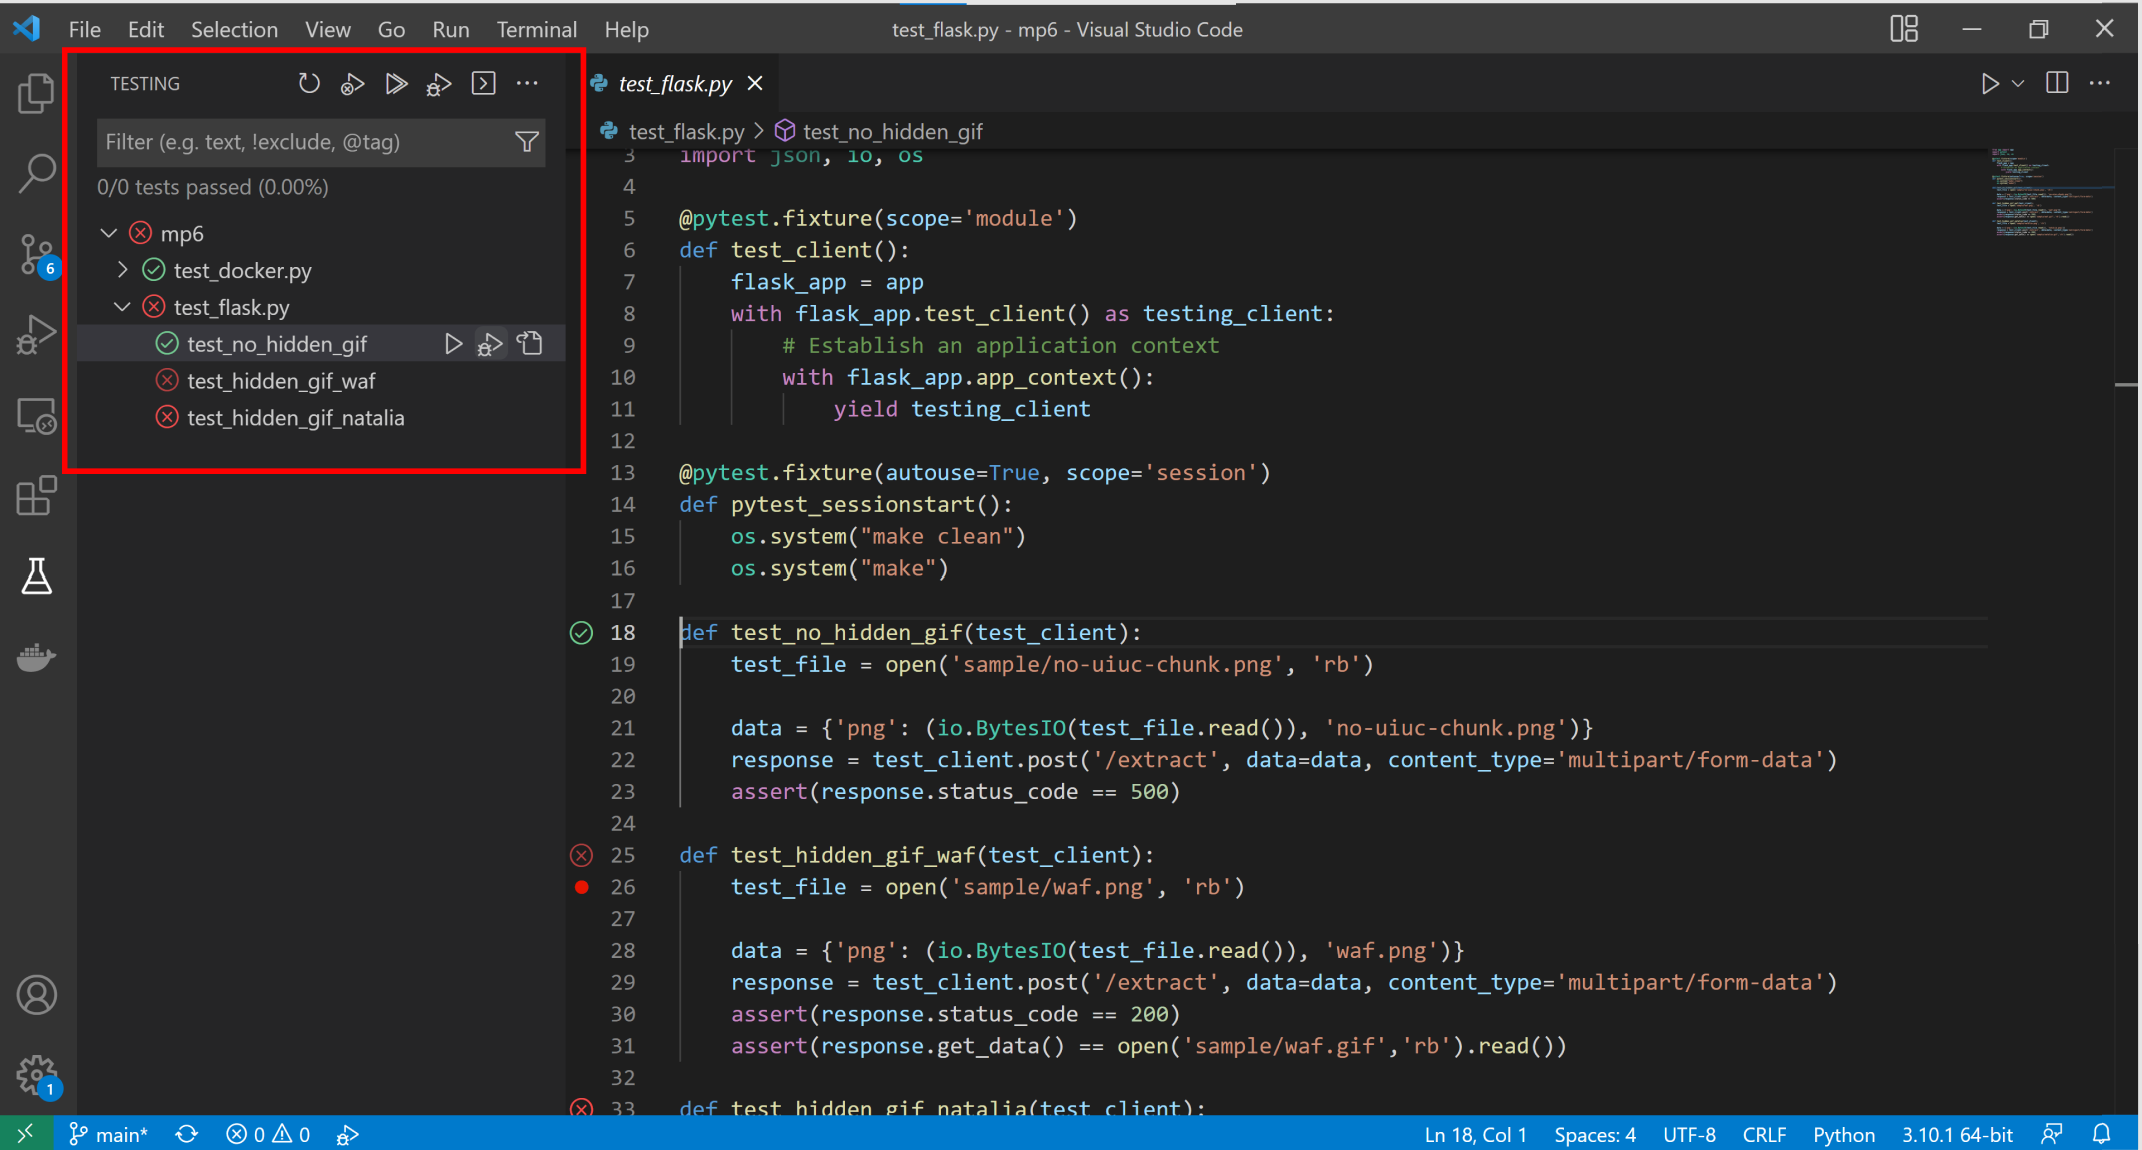
You should see all the test files with their test cases listed in the Testing tab. You can run and debug each individual test case or the entire test file, look at the output, etc. through the interface.
For more information, please check out Python testing in Visual Studio Code.
Useful Features
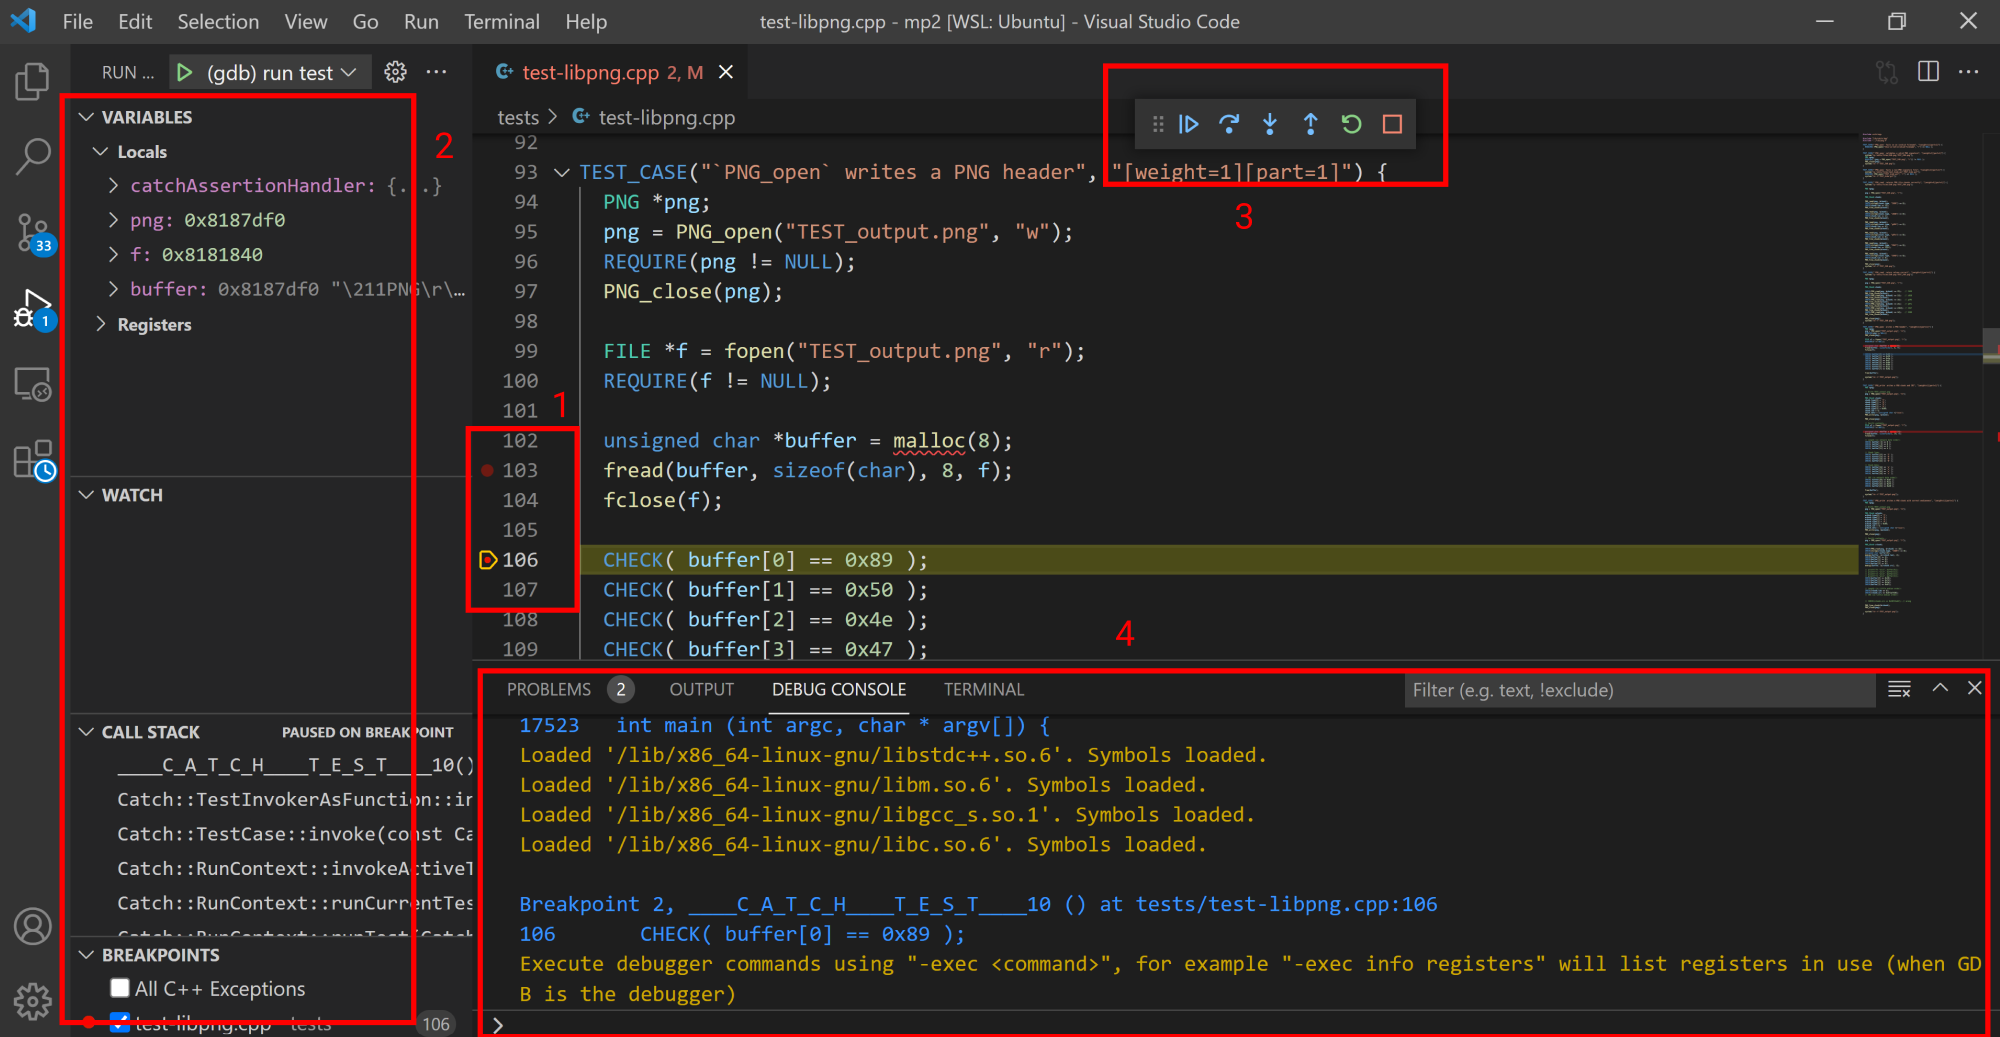
The visual debugger works pretty much like the command line version of GDB, where you can pause the execution of a program to examine its states and memory. Even if you have never used GDB before, the debugging interface provided by VS Code is fairly intuitive and easy to get around.
Some of the useful features include:
- Adding or removing breakpoints by clicking on the red dot to the left of the line number. The program will pause at each breakpoint you set
- Examining the state of the program when its execution is paused. For example, you can look at local variables, resgisters, function call stack, etc
- Stepping into, over, or out of a function. Continue the execution until the next point. You can use these options to control the flow of your program (e.g. executing your code line by line) in order to see how your program states change
- Using the Debug Console to execute any additional debugger commands you want. For example,
-exec info registerswill list registers in use