This is not a full MP; it is primarily testing your setup and ensuring you are ready for subsequent MPs. It is dramatically easier than other MPs. Don’t plan your time on other MPs based on this one.
We have some initial code for your mp0 for you to get started. Use the following command in your cs340/netid directory to merge our initial mp0 directory into your local repository:
A goal of this MP is to help you feel comfortable with using Visual Studio Code. You should try out the following:
Opening a Project Folder: Most of Visual Studio Code’s project-related features are based on the root of the current folder you have open within Visual Studio Code. Make sure to open the mp0 folder in Visual Studio Code. (You cannot open your cs340 directory, or your netid directory, it must be your mp0 directory.)
From a terminal, you can run code . to open up VS Code from that folder.
Inside of VS Code, you can use File -> Open Folder to open a new folder.
Opening the Integrated Terminal: The keyboard shortcut Ctrl + ~ will open/close the integrated terminal inside of Visual Studio Code. Using the integrated terminal, let’s verify you are all set up for running C programs by doing the following:
On your terminal, run make to compile the provided code.
If you receive any errors, read the error messages. They will often be helpful to describe what’s going wrong. If you’re stuck here, reach out to get help!
Running a Visual Debugger: As part of the provided code, we have provided .vscode/launch.json. This configuration file is used by Visual Studio Code to understand the steps needed to run your project. It will compile your code using make and then run ./main inside of a debugger connected to VS Code. Use Visual Studio Code to run your project:
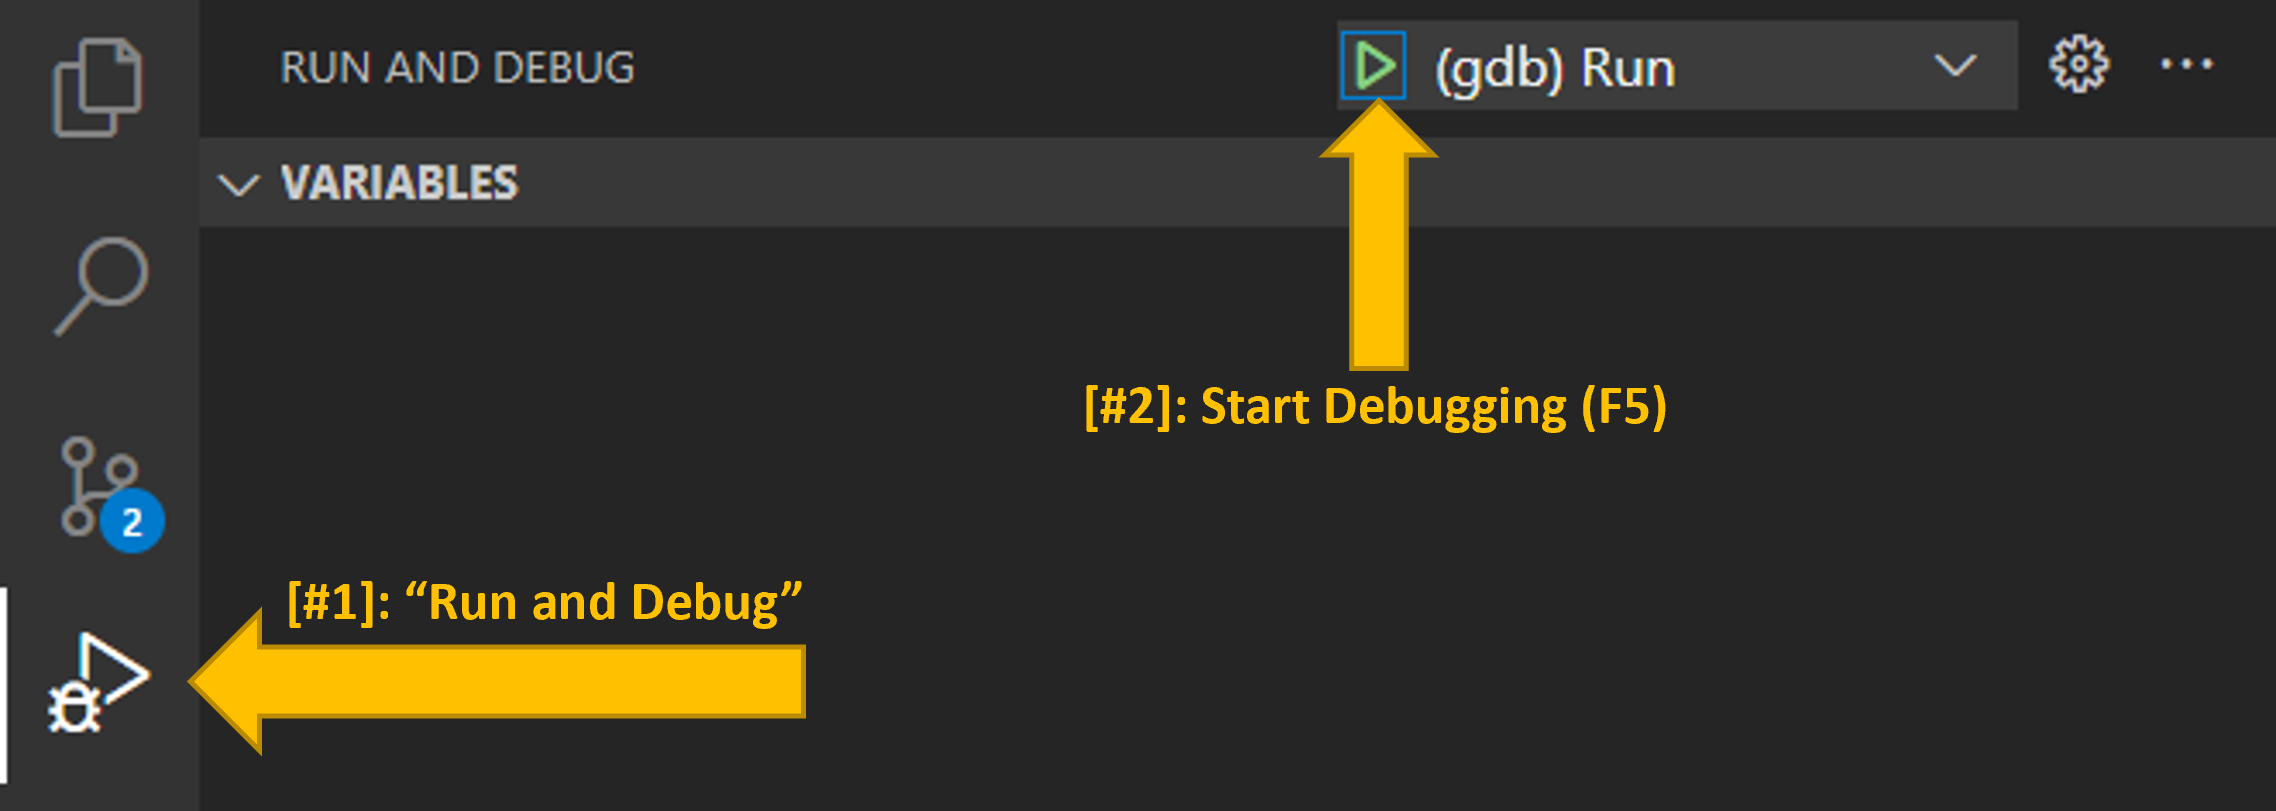
On the left side of Visual Studio Code, find the Run and Debug Interface (#1).
Once on the Run and Debug interface, find the green Debug arrow to start your program with a visual debugger (#2).
Location of debug buttons in default VSCode intrface
Press <Enter> to accept tay.gif as the input file. You’ll use your own gif later.
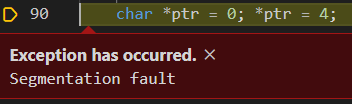
If the launch of the visual debugger was successful, you will see the program execution pause at the exact moment when the segmentation fault occurred. This may be one of the few times you will ever want a segmentation fault to show up!
Example segfault error notification
Extra setup for M1/M2 Macs
Some users of M1 and M2 Macs report that they are unable to run the visual debugger with the provided launch.json.
Sample Error Output
Warning: Debuggee TargetArchitecture not detected, assuming x86_64.
ERROR: Unable to start debugging. Unexpected LLDB output from command "-exec-run". Command 'exec-run'. Invalid process during debug session
The program ‘/path/to/file/mp0/main' has exited with code 42 (0x0000002a).
To fix this
install the CodeLLDB extension on VSCode
update the type field in your launch.json to reflect this: "type": "lldb"
You may need to make similar changes to the launch.json of subsequent MPs as well.
4 Debug the Code
The purpose of this MP is to get comfortable with Visual Studio Code and viewing C code. The gif.c file provided is based off of Marcel Rodrigues’ ultra-small GIF encoding and decoding library, but then modified to allow us to Illinify any GIF animation.
Unfortunately, there are several bugs in the code that prevent it from running. You will need to use the Visual Studio Code debugger to help find the bugs.
Every bug we introduced except for one can be fixed by commenting out a single line of gif.c to resolve the bug.
The remaining bug requires you make one change to an existing line of code.
Fixing the bug is a tool to help you learn to use the debugger. To optimize your learning, use the follow common debugging patterns:
4.1 Common Debugging Pattern #1: Segmentation Faults
When you run the provided code, you will immediately have a segmentation fault. When using an interactive debugger, you will see the exact position in code when the segmentation fault occurs.
A segmentation fault is an access to a memory address that is not allocated to your process. Often, the line of code where the segmentation fault occurs is valid code. You may need to inspect the code executed in the lines prior to the segmentation fault.
Other errors in the code, like infinite recursion, can cause a segmentation fault when the process runs out of available memory allocated to the process to add a new stack frame.
You will fix several segmentation faults throughout mp0.
4.2 Common Debugging Pattern #2: Terminal Messages on Abort
A segmentation fault is only one type of exception that can occur in your code. Other exceptions will provide additional information in stdout or stderr reported on your integrated VS Code terminal.
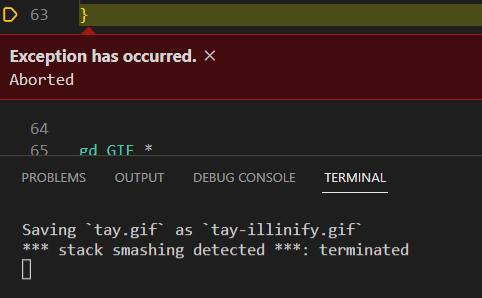
In this bug you will find that the debugger reports *** stack smashing detected ***:
Example stack smashing abort message
Stack smashing occurs when you write onto stack frame of a function, which is the memory immediately following the local variables to the function. Check the code to find out where we might have written a few too many bytes. (This is the one and only place in mp0 where you don’t comment a line to fix a bug, but modify it.)
You will find additional output in the terminal when finding other bugs throughout mp0.
macOS Specific Information
The default debugger on macOS, lldb, was not able to give a useable stack trace on this stack smashing bug. To fix this bug, figure out the error on Line 61 – where read is called inside of the read_num function.
4.3 Common Debugging Pattern #3: Examining the Call Stack
When your program is paused (due to an exception, you pressing pause, a breakpoint you set, or any other reason), the Run and Debug window shows a wealth of useful debugging information.
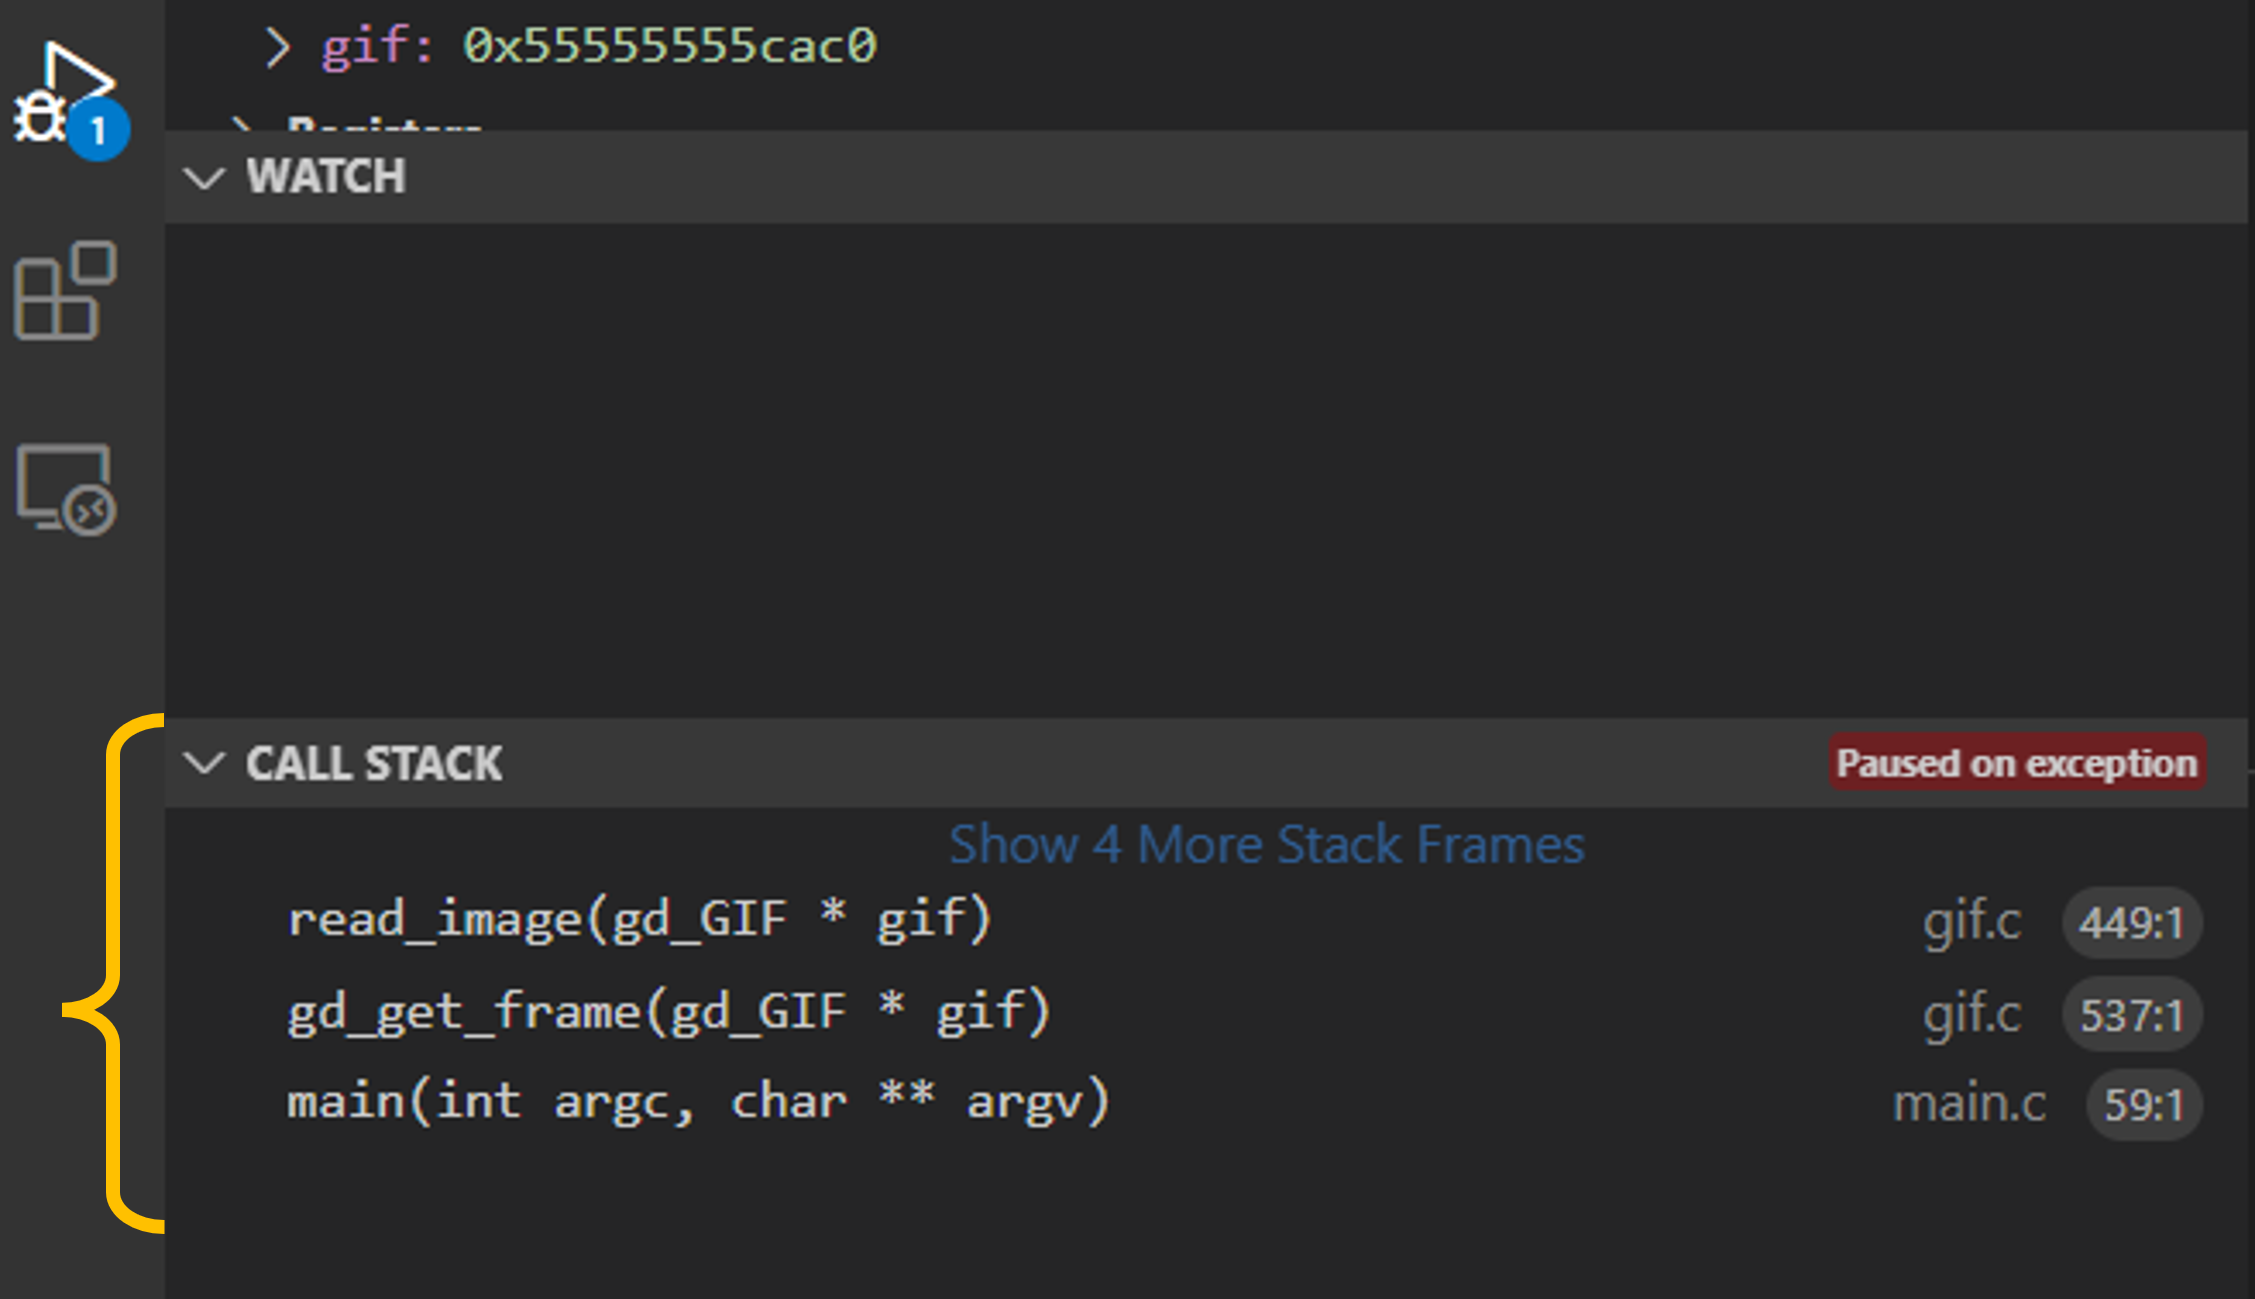
One panel is labeled Call Stack. It will list the function calls that were called leading to where your program is currently paused. You can click on them to jump to their location in code.
Example call stack
In a call stack, the top is the most recent function called. Specifically, the above call stack shows the read_image function located in gif.c was called and the current line being executed is Line 449. This function was invoked by the function below (gd_get_frame), which itself was invoked by the function below that (main), which is the starting point of this execution.
The call stack is very useful for finding infinite recursion if you see the same function name again and again and again. You will want to reference the call stack for several bugs in mp0.
4.4 Common Debugging Pattern #4: Using Pause and Code Stepping
A common programming error is in accidental infinite loop, where no exception occurs but your program is stuck. A common debugging pattern is to pause the execution and examine the code where your program is stuck.
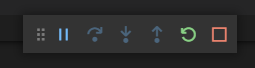
When Visual Studio Code is running your code, you will see the control window:
Pause button and other debugged execution controls
Pressing the left-most Pause button will pause the execution of the program and provide you information about the current point of execution. When the program is paused:
You can hover over variables to see the values their hold,
You can view the call stack and other debugging information,
You can use the control window to step through your code line-by-line,
…and more!
4.5 Common Debugging Pattern #5: Setting Breakpoints
Instead of pausing the program manually, programmers will set a breakpoint to have the program automatically pause immediately before running the line of code where the breakpoint is set.
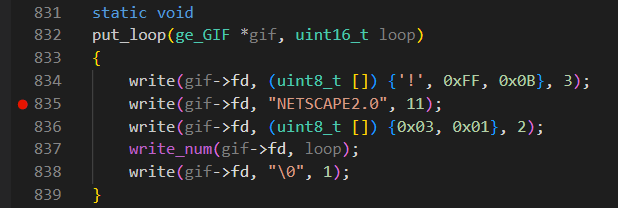
To set a breakpoint, click on the space immediately to the left of the line number. A bright red dot will appear to indicate that an active breakpoint is set:
Marker indicating a break point set on line 835
In the example above, execution will pause after running Line 834 but before running Line 835. Since it’s paused, you can inspect all of the variables at the exact moment before running Line 835. If you resume the program and the breakpoint is encountered again, it will pause again.
5 Discovering a Hidden Message
Once you have all the bugs debugged, the program will complete and process all of the GIF frames and produce tay-illinify.png – you have just done an Illinify transformation of a Taylor Swift GIF!
Original tay.gif
Partial Illinification
Nope.
That’s not enough Illini.
Did it even work?
5.1 Final Fix: A Hidden Message
As your final debugging task, I hid a message for you in the source code. Use your knowledge of Visual Studio Code debugging, find the value stored inside of the global variable messageat any time after the _illinify function is called. (Hint: Set a breakpoint; I purposefully made sure the message would not show up if you just use printf.)
Follow the instructions stored in the variable message I hid for you, run the program, and check out how tay-illinify.gif looks now!
6 Course Discord
The primary CS 340 virtual space is the CS 340 Discord server. I want to see your favorite GIF, and make sure you’re all set up with Discord so you can be part of the CS 340 community.
If you have not already, join the CS 340 Discord. Change your nickname on the CS 340 server to something where we know who you are on Discord (either your first name, your NetID, something) or DM luthertychonievich to privately share your username/identity association so we can give you points.
Illinify a GIF of something special to you (yourself, a celebrity, a hobby, whatever).1 Hopefully you intuited this, but the gif should be safe for work: nothing offensive, abusive, hate-based, or lewd.
Post your transformed GIF to the #mp0-gifs Discord channel.
7 Submission and Grading
7.1 Testing Suite
When you are finished working on the MP, you can run a local copy of the same test suite that you will use for grading. To run the test suite:
To compile the test suite, run make test.
To run your code, run ./test and everything should pass!
7.2 Submission
Once you have locally passed all the tests, you will need to submit and grade your code. First commit using the standard git commands:
git add -Agit commit -m"MP submission"git push
7.3 Grading
The initial grading is done via a manual GitHub Action. You MUST complete this step before the deadline to earn any points for the MP:
Click the green Run Workflow button (located on the blue bar)
Press Run Workflow
You will trigger a GitHub Action that will complete the grading run!
7.4 Weight
The test suit is given 75% weight in this MP
Posting an Illinified gif to Discord is given 25% weight for this MP
Frequently-asked questions
What kind of personal access token should I use?
We have multiple reports of classic tokens working. Remember to grant it repo-related powers and set it to expire after the semester ends!
What should I do if I get the error re-authorize the OAuth Application GitHub CLI?
Run gh auth login.
Do I have to keep typing my personal access token in as a password?
No; see our github page for one way around this.